
100
Class 1 up. Class 1down. Class 2 up. Class 2down. Class 3 up. Class 3 down. Class 4 up. Class 4 down. 1600. down. 1400. 1200. up. 1000. Length (ntde). 800. 600. 400. 200. 0. 5' UTR. 3' UTR. CDS. A. 100. 90. 80. RL DS (%). 70. 60. R 2 =0,9393. 50. 60. 70. 80. 90.

100
E N D
Presentation Transcript
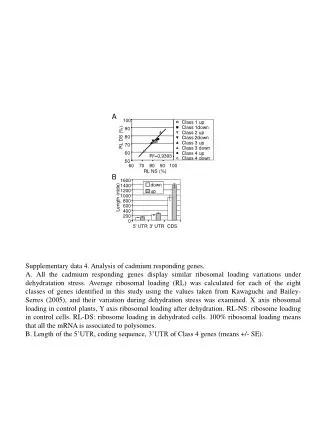
Class 1 up Class 1down Class 2 up Class 2down Class 3 up Class 3 down Class 4 up Class 4 down 1600 down 1400 1200 up 1000 Length (ntde) 800 600 400 200 0 5' UTR 3' UTR CDS A 100 90 80 RL DS (%) 70 60 R2=0,9393 50 60 70 80 90 100 RL NS (%) B Supplementary data 4. Analysis of cadmium responding genes. A. All the cadmium responding genes display similar ribosomal loading variations under dehydratation stress. Average ribosomal loading (RL) was calculated for each of the eight classes of genes identified in this study using the values taken from Kawaguchi and Bailey-Serres (2005), and their variation during dehydration stress was examined. X axis ribosomal loading in control plants, Y axis ribosomal loading after dehydration. RL-NS: ribosome loading in control cells. RL-DS: ribosome loading in dehydrated cells. 100% ribosomal loading means that all the mRNA is associated to polysomes. B. Length of the 5’UTR, coding sequence, 3’UTR of Class 4 genes (means +/- SE).


