Download
1 / 71
730 likes | 929 Views
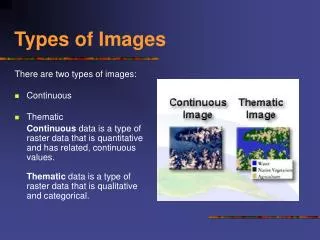
Types of Images. There are two types of images: Continuous Thematic Continuous data is a type of raster data that is quantitative and has related, continuous values. Thematic data is a type of raster data that is qualitative and categorical. Image Display.

E N D
Types of Images There are two types of images: • Continuous • Thematic Continuous data is a type of raster data that is quantitative and has related, continuous values.Thematic data is a type of raster data that is qualitative and categorical.
Image Display • An image refers to any pictorial representation, regardless of what wavelengths or remote sensing device has been used to detect and record the electromagnetic energy. • An image may be represented and displayed in a digital format by subdividing the image into small equal-sized and shaped areas, called picture elements or pixels, and representing the brightness of each area with a numeric value or digital number.
Pixel Size • most remote sensing images are composed of a matrix of picture elements, or pixels, which are the smallest units of an image • If a sensor has a spatial resolution of 20 metres and an image from that sensor is displayed at full resolution, each pixel represents an area of 20m x 20m on the ground
Basics • Radar is an acronym for RAdio Detection And Ranging. • Radar systems were originally developed in order to detect the presence and position of objects using transmitted and received radio waves • Due to the electromagnetic properties of radio waves radar systems are capable of collecting data in nearly all atmospheric conditions, by day and/or night.
Basics • Imaging radar systems have been in use since the 1950s. • They were originally developed by the military. • Radar as a remote sensing tool became more commonly used as military systems were declassified and scientists developed new applications in mapping and resource monitoring.
Imaging and Non-Imaging Systems • Radar systems may or may not be imaging systems • An example of a non-imaging system is a doppler radar system that are used to measure vehicle speeds by measuring the frequency. • Plan position indicators (PPI) produce a type of image. These radars use a circular display screen to indicate objects surrounding the rotating antenna.
Active and Passive Imaging Systems • Imaging radar systems can be active or passive. Active radar systems transmit short bursts or 'pulses' of electromagnetic energy in the direction of interest and record the origin and strength of the backscatter received from objects within the system's field of view. • Passive radar systems sense low level microwave radiation given off by all objects in the natural environment.
Examples • Radar imaging systems such as ERS (European Remote Sensing Satellite), JERS (Japan Earth Resources Satellite), and RADARSAT-1 are active systems. • They both transmit and receive energy. Microwave scanning radiometers only receive microwave energy. • The Japanese MOS (Marine Observation Satellite) and JERS satellite systems employ microwave scanning units.
Radar and the Electromagnetic Spectrum • Uses Microwave part of the spectrum • Microwaves are much longer, ranging from 1 mm to 1 metre. • Radar band designations range from the Ka band occurring between 7.5 and 11.0 mm to the P band range between 30 and 100 cm.
Radar and the Electromagnetic Spectrum • Any system transmitting and/or receiving energy from the Earth's surface is affected by the atmosphere. • Water vapor, dust, smoke, airborne pollutants and other small particles close in magnitude to visible and infrared (VIR) wavelengths cause interference in the path between target and sensor. • VIR wavelengths can be dispersed or blocked before they reach the sensors. Since microwaves are longer, they are not as affected by these types of small particle matter. • Therefore, sensors transmitting and/or receiving microwaves are able to 'see' through haze, cloud, light rain, snow, smoke, and pollution. As a result, radar images can yield valuable information that is not available in VIR images.
Radar Systems in Remote Sensing • In order to understand how a radar imaging system produces imagery, a comparison with optical imaging systems is useful. • Photographs or scanned images are the product of systems which use visible light and near infrared radiation and are the result of near instantaneous exposure. • In contrast, radar imagery is produced by recording microwave pulses travelling to and from a target area over a period of time.
Radar Systems in Remote Sensing • The optics-equivalent in a radar imaging system is a long, rectangular antenna which transmits and receives microwave energy. • Resolution, which is the ability of a system to differentiate between two closely spaced objects, is dependent on focal length in optical sensors and in the along-track direction antenna length in radar systems
Radar Systems in Remote Sensing • Antennas are analogous to lens systems in that a long antenna can be compared to a telephoto (long focal length) lens, while a shorter antenna is similar to a wide angled (short focal length) lens. • To continue the analogy, a long antenna provides a detailed, or high-resolution image of a small area, while a short antenna provides an image of a large area with less detail.
Range Resolution • P = pulse length • 1, 2 = two targets that are too close together to be resolved as individual targets • 3, 4 = two targets with sufficient range separation to be resolved as individual targets
Range Resolution • Resolution in a radar system is controlled by the signal pulse length and the antenna beam width. • The signal pulse length dictates resolution in the direction of energy propagation. • This is referred to as the range direction. Shorter pulses result in a higher range resolution
Resolution in the flight or azimuth direction • The width of the antenna beam determines the resolution in the flight or azimuth direction. • The beamwidth is directly proportional to radar wavelength and is inversely proportional to the length of the transmitting antenna. • This means that resolution deteriorates with distance from the antenna. • In order to have a high resolution in the azimuth direction the radar antenna must be very long. • A = antenna beam • 1, 2, = two targets that can be resolved as being separate • 3, 4, = two targets that cannot be resolved as being separate
Categories of Radar Remote sensing radars can be divided into two categories • real aperture, and • synthetic aperture radars (SAR). Real aperture radars transmit and receive microwave signals with a fixed length antenna. They are limited in their ability to produce resolutions fine enough for most remote sensing applications, simply because it is difficult to transport a very long antenna.
Categories of Radar • To solve this problem synthetic aperture radars (SAR) were developed. • SARs have physically shorter antennas, which simulate or synthesize very long antennas. • This is accomplished through modified data recording and signal processing techniques.
Radar system geometry • Hn = flying height • ß = depression angle • Øn = near edge incidence angle • Øf = far edge incidence angle • s = slant range • g = ground range • a = ground range resolution (x direction) • b = azimuth resolution (y direction) • e = slant range resolution
Incidence Angle • Incidence angle describes the relationship between radar illumination and the ground surface. • Specifically, it is the angle between the radar beam and a target object. • The incidence angle helps to determine the appearance of a target on an image.
Local incidence angle • local incidence angle can be determined for any pixel on an image. • Trees, rocks, buildings, other structures and different terrains create changes in the local incidence angle. • This in turn causes variations in pixel brightness
Local incidence angle • Due to their greater altitude, satellite incidence angles vary less than airborne incidence angles. • This leads to more uniform illumination on satellite images than airborne radar images.
Slant Range and Ground Range • Radar imaging systems record the differences in travelling times between return signals. • The distance between an object and the antenna is equal to the speed of propagation of the wavelength through the atmosphere multiplied by the time it takes to reach the antenna • A direct relationship between the slant range and the ground range also exists. Since we know the angles at which the microwaves are propagated, we can use trigonometry to calculate the ground range.
Slant Range and Ground Range Slant Range Image Ground Range Image
Radar Imagery VIR image (left) and radar image (right)
Relief Displacement • Vertical structures on radar images, and aerial photographs or VIR satellite images appear to be very different. • The most obvious difference is that relief displacement is in opposite directions
Geometric relationship The four characteristics resulting from the geometric relationship between the sensor and the terrain that are unique to radar imagery are: • foreshortening • pseudo-shadowing • layover, and • shadowing
Foreshortening • Foreshortening (A'B') is the effect by which the foreslopes of hills and mountains appear to be compressed. • The image of foreslopes will therefore appear brighter than other features on the same image. • The greatest amount of foreshortening occurs where the slope is perpendicular to the incoming radar beam. The base, slope and top of the mountain will be imaged at the same time and will be superimposed on the image. • Foreshortening can be minimized by using a less sharp incidence angle. However, lower incidence angles allow for more shadowing to occur on the image.
Foreshortening While the hill slopes AB and BC are equal, the foreslope (AB) is compressed (A'B') much more than the backslope (BC) is compressed (B'C'), due to the radar imaging geometry. BACK
Pseudo-shadowing An effect by which the backslope of hills and mountains appear to be expanded. It is the result of return signals spread out over a larger distance (A', B') than the actual horizontal distance (A, B) A', B' = return signal spread A, B = actual ground distance A'< A B' > B
Layover • The effect where the image of an object appears to lean toward the direction of the radar antenna. • It is the result of the tops of objects or slopes being imaged before their bases. • Layover effects are most severe on the near range side of images. While the mountain slopes AB and BC are equal, the radar imaging geometry dictates that the radar-facing slope (AB) will be imaged (B'A') as leaning toward the radar. This is due to the mountain top (B) having been imaged before the base(A) due to RA > RB.
Shadow • Very useful to image interpreters interested in terrain relief. • As discussed in the first chapter, shadowing is one of the psychological cues used for depth perception. • Radar shadows produce a 3-D effect without the use of a stereoscope
Shadow Example of radar shadow effects under large incidence angle (>45°) illumination 1 = Shadow area not imaged 2 = Radar shadow on image BACK
Microwave properties Objects on the Earth's surface react differently with electromagnetic energy. The strength of reflected energy, which is recorded in order to produce a radar image, depends on factors such as: • the orientation of topographic features, • surface roughness, • thickness of surface cover, and • moisture content / dielectric properties.
Surface Roughness • Surface roughnessis determined with respect to radar wavelength and incidence angle. • A surface will appear to be smooth if its height variations are smaller than one-eight of the radar wavelength. • In general, a rough surface is defined as having a height variation greater than half the radar wavelength. • Surfaces will appear to have a greater or lesser degree of roughness, depending on which designated radar bandwidth is used for imaging. • In terms of a single wavelength, a surface appears smoother as the incidence angle increases. • On radar images, rough surfaces will appear brighter than smoother surfaces composed of the same material. NEXT
Surface Roughness A = antenna; h = height variations of surface; Smooth surface; specular reflection; no return.
Surface Roughness A = antenna; h = height variations of surface; Intermediate roughness; mixed scatter; moderate return
Surface Roughness A = antenna; h = height variations Rough surface; diffuse scatter; strong return BACK
Reflectivity • Surface roughness influences the reflectivity of microwave energy. • Horizontal smooth surfaces that reflect nearly all incidence energy away from the radar are called specular reflectors. • These surfaces, such as calm water or paved roads appear dark on radar images.
Moisture Content • Moisture content changes the electrical properties of a material, which in turn affects how the material will appear on a radar image. • The reflectivity, and therefore image brightness of most natural vegetation and surfaces increases with greater moisture content. • Consequently, soil moisture maps can be derived from radar backscatter A = irrigated field,B = non-irrigated field
Classic rectangular SAR or SLR
Doppler Binning So source moving toward observer generates shorter wavelengths, higher frequencies.
Dish antenna Rectangular antenna
Isodop is a line of constant Doppler shift; figure shows how the isodop position varies across the surface plane.
Dotted lines show circles of constant range; solid lines show isodops.
Processing e.g. automatic track • Various waveforms & processing depends on use