Analysis
Results. Means and Standard Deviations for PSS and STAI at Period 2.

Analysis
E N D
Presentation Transcript
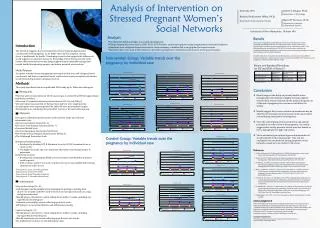
Results Means and Standard Deviations for PSS and STAI at Period 2 There were no significant group differences between Social Network scores & Optimism/Pessimism Ratios for any of the time periods. However there were significant group differences between PSS & STAI scores within time period 2. The intervention group showed lowered PSS & STAI scores than the control group. In addition, both groups displayed a trend of lower stress and anxiety perceptions on these two measures over the entire pregnancy. Variable trend charts revealed no discernible patterns on the measures that differed between both groups. Both groups showed some modest variability in the measures across pregnancy, or they remained relatively stable. The literature suggests that environmental events and psychological stress can affect the developing fetus (2, 6). While stress itself is adaptive, chronic stress is problematic for health. Developing research also supports the influence of social supports on maternal stress (4). Knowledge of how behavioral and social factors affect maternal stress may help pregnant women optimally manage their mental health throughout pregnancy and inform potential interventions. *Kruskal-Wallis, alpha < .05 Study Purpose: To explore whether stress management interventions that were self-designed based on interests, and thus occupational-based, could reduce stress perception and enhance social relationship quality in pregnant women. Conclusions • Results support the ability to provide feasible stress management interventions in highly stressed pregnant women. Most women remained in the study (2 dropped out at the end of pregnancy for reasons not related to the study). • Results suggest that stress reduction interventions may be effective for lowering overall stress perception and anxiety at least during some portion of pregnancy. • Since the control group also lowered stress and anxiety perception over the course of the pregnancy, the results suggests that weekly personal contact may also benefit as stress management for high risk women. • Stress and anxiety perceptions appeared independent of social networks in this small sample. This was not anticipated; we assumed that strong supportive social networks would serve as a buffer to life stress. Measures Intervention References 1. Cohen, S; Kamarck, T., & Memmelstein, R. (1983). Global measure of perceived stress. Journal of Health and Social Behavior24, 386-396. 2. Glover, V. (1997). Maternal stress or anxiety in pregnancy and emotional development of the child. British Journal of Psychiatry, 171, 105-106. 3. Norbeck, J. S. (1995). Scoring Instructions for the Norbeck Social Support Questionnaire (NSSQ), revised 1995. Unpublished manual available online through the UCSF School of Nursing website: www.nurseweb.ucsf.edu 4. Rini, C., Schetter, C., Hobel, C. J., Glynn, L. M., & Sandman, C. A. (2006). Effective social support: Antecedents and consequences of partner support during pregnancy. Personal Relationships, 13, 207-229. doi:10.1111/j.1475-6811.2006.00114.x 5. Scheier, M. F., Carver, C. S., & Bridges, M. W. (1994). Distinguishing optimism from neuroticism (and trait anxiety, self-mastery, and self-esteem): A re-evaluation of the Life Orientation Test. Journal of Personality and Social Psychology, 67, 1063-1078. 6. Schneider, M. L., Moore, C. F., & Kraemer, G. W. (2003). On the relevance of prenatal stress to developmental psychopathology: A primate model. In D. Cicchetti & E. Walker (Eds.), Neurodevelopmental mechanisms in psychopathology (pp. 155-186). New York, NY: Cambridge University Press. 7. Spielberger, C.D. (1977). State-Trait Inventory for Adults. Redwood City, CA: Mind Garden. Analysis of Intervention on Stressed Pregnant Women’s Social Networks Amy Ma, OTS Barbara Prudhomme White, Ph.D. Robert C Drugan, Ph.D. Department of Psychology David H Townson, Ph.D. Department of Occupational Therapy Department of Animal & Nutritional Sciences University of New Hampshire, Durham NH Analysis • Psychometric behavioral data was coded and analyzed. • Group comparisons were done on PSS, STAI, LOT-R ratios and social supports using nonparametric inferential statistics. • Questions were collapsed across measures to create summary variables that were graphed for trend analysis. • Narrative data were used in the analysis as possible explanations to statements and answers in the questionnaires. Introduction Intervention Group: Variable trends over the pregnancy by individual case Methods This study used data from an unpublished 2008 study by Dr. White and colleagues. Participants • Thirteen white women between 18-31 years of age, recruited from NH through prenatal healthcare providers. • All scored 1.5 standard deviations above mean on PSS (1) and STAI (7). • One participant was married, 10 had partners and two were single parents. • 4 participants were expecting their first child. All were heterosexual couples. • Participants were randomly placed in either control or the intervention group. • Participants submitted questionnaires each trimester made up of various assessment tools: • The Perceived Stress Scale (PSS; 1) • The State-Trait Anxiety Inventory (STAI; 7) • Perceived Health Scale • The Life Orientation Test-Revised (LOT-R;5) • The Norbeck Social Support Questionnaire (NSSQ; 3) • The Edinburgh Depression Scale • Optimism/Pessimism Ratio • Developed by dividing LOT-R Optimism Score by LOT-R Pessimism Score to create a ratio • The higher the value, the more optimistic the mother was feeling relative to pessimism. • Social Network Score • Developed by summing the NSSQ scores of women’s self-identified top three social supports. • If the woman’s partner was in the top three, his score was doubled before being added to the other scores. Control Group: Variable trends over the pregnancy by individual case Time period 1: up to 12 weeks gestation Time period 2: from 13-27 weeks Time period 3: from 28 weeks to delivery Time period 4: 2-3 months after delivery • Intervention Group (N = 6): • Self-designed and meaningful stress management package, including their • choice of 1-2 funded activities each week such as massage, hair/nail care, yoga, • and gym membership. • Weekly phone calls and/or e-mails asking about mothers’ weeks, including any • cigarette/alcohol/drug use. • Submission of weekly journals reflecting upon their week. • MP3 players to record and listen to self-affirmations weekly. • Control Group (N = 7): • Weekly phone calls and/or e-mails asking about mothers’ weeks, including • any cigarette/alcohol/drug use. • Weekly submission of journals reflecting upon the past two weeks. • No funded interventions, no self-affirmation tasks. Acknowledgements • Sincere thanks to the women who participated and to those who supported them. • Thank-you to UNH for a Presidential Excellence Research Award; to the Carsey • Institute at UNH; and to Mary Schneider at the University of Wisconsin, Madison, WI. • Thank-you to the UNH Hamel Center & McNair Graduate Opportunity Program. • Thank-you to K.E. Vroman for inspiration in poster design. • Artwork courtesy of Barbara Getrost: info@pregnantearth.com. Contact Information B. Prudhomme White, Department of Occupational Therapy, University of New Hampshire, Durham NH 03824