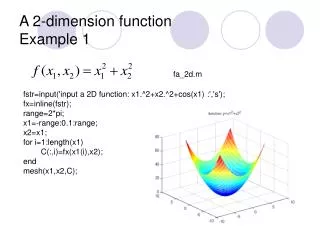
A 2-dimension function Example 1
A 2-dimension function Example 1. fa_2d.m. fstr=input('input a 2D function: x1.^2+x2.^2+cos(x1) :','s'); fx=inline(fstr); range=2*pi; x1=-range:0.1:range; x2=x1; for i=1:length(x1) C(:,i)=fx(x1(i),x2); end mesh(x1,x2,C);. Sampling training data.

A 2-dimension function Example 1
E N D
Presentation Transcript
A 2-dimension functionExample 1 fa_2d.m fstr=input('input a 2D function: x1.^2+x2.^2+cos(x1) :','s'); fx=inline(fstr); range=2*pi; x1=-range:0.1:range; x2=x1; for i=1:length(x1) C(:,i)=fx(x1(i),x2); end mesh(x1,x2,C);
Sampling training data N=input('input the number of sample:'); x=rand(2,N)*4*pi-2*pi; y=fx(x(1,:),x(2,:)); y=y+rand(1,N)*3-1.5; N=length(x); ind=randperm(N); N2=floor(N/2); X_TRAIN=x(:,ind(1:N2)); Y_TRAIN=y(ind(1:N2)); figure plot3(X_TRAIN(1,:), X_TRAIN(2,:), Y_TRAIN,'.')
Step 1 Searching means • Kmeans K=20; figure plot(X_TRAIN(1,:),X_TRAIN(2,:),'b.') [cind,center]=kmeans(X_TRAIN',K); hold on plot(center(:,1),center(:,2),'rP')
Step 2 Cross Distances D = cross_distance(X_TRAIN',center); Cross distances between centers and data points D(i,j) stores the distance between the ith data point and the jth center
Step 3 Posterior weights • Radial basis function
h=40; a=pinv(exp(-D/h))*Y_TRAIN';
Approximating function X_TRAN centers D = cross_distance(X_TRAIN',center); a, h Y_HAT=exp(-D/h)*a; Y_HAT figure plot3(X_TRAIN(1,:),X_TRAIN(2,:),Y_TRAIN,'.') hold on plot3(X_TRAIN(1,:),X_TRAIN(2,:),Y_HAT,'rx')
Form X_test range=2*pi; x1=-range:0.5:range; x2=x1; X_test=[ ]; for i=1:length(x1) xx = [x1(i)*ones(1,length(x2));x2]; X_test=[X_test xx]; end figure plot(X_test(1,:),X_test(2,:),'.')
X_test centers D = cross_distance(X_test',center); a, h Y_test=exp(-D/h)*a; Y_test figure CC=reshape(Y_test,length(x1),length(x1)); mesh(x1,x2,CC);
A 2-dimension functionExample 2 fstr=input('input a 2D function: x1.^2+x2.^2+cos(x1) :','s'); fx=inline(fstr); range=2*pi; x1=-range:0.1:range; x2=x1; for i=1:length(x1) C(i,:)=fx(x1(i),x2); end mesh(x1,x2,C);
[cind,center]=kmeans(X_TRAIN',K); Input X_TRAIN, K, h D = cross_distance(X_TRAIN',center); a=pinv(exp(-D/h))*Y_TRAIN'; Y_HAT=exp(-D/h)*a; K=20,h=40
range=2*pi; x1=-range:0.5:range; x2=x1; X_test=[ ]; for i=1:length(x1) xx = [x1(i)*ones(1,length(x2));x2]; X_test=[X_test xx]; end figure plot(X_test(1,:),X_test(2,:),'.') Form X_test
Input X_test, a, h D = cross_distance(X_test',center); figure Y_test=exp(-D/h)*a; CC=reshape(Y_test,length(x1),length(x1)); mesh(x1,x2,CC);