Download
1 / 53
610 likes | 954 Views
Quantitative Review II Spring 2013. Quantitative Review II.

E N D
Quantitative Review II Spring 2013
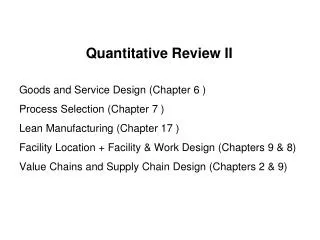
Quantitative Review II Goods and Service Design (Chapter 5 )Process Selection (Chapter 7 )Lean Manufacturing (Chapter 16 )Reliability (Chapter 17)Facility Location + Facility & Work Design (Chapters 8 & 9)Value Chains and Supply Chain Design (Chapters 11)
Taguchi measures quality as the variation from the target value of a design specification and then translats that variation into an economic “loss function” that expresses the cost of variation in monetary terms • Where : • x = is the actual value of the product dimension • T = target limit • L(x) = the monetary value of the loss associated with deviating from the target limit “T” • k = the constant that translates the deviation into dollars • Designing a product with a smaller design tolerance = better quality Key Concept: Taguchi Loss Function
Example: A quality engineer has a manufacturing specification (in cm) of 0.200 plus or minus 0.05. Historical data indicates that if the quality characteristic takes on values larger than .25 cm or smaller than .15 cm, the product fails and a cost of $75 is incurred. Determine the Taguchi Loss Function and estimate the loss for a dimension of 0.135 cm. T = 0.2 (cm); X< 0.15 (cm) or X> 0.25 (cm); L (X) = $75 75 = k (0.15-0.2)2 or 75 = k (0.25-0.2)2 K = 30,000 Taguchi Loss Function: L(X) =30,000 (x-T)2 75= k (± 0.05)2
Example: A quality characteristic has a specification (in inches) of 0.200 0.020. If the value of the quality characteristic exceeds 0.200 by the tolerance of 0.020 on either side, the product will require a repair of $150. Develop the appropriate Taguchi loss function (k). The Taguchi Loss Function is: L(x) = k(x - T)2 (x-T)2 = ( 0.020)2 150 = k( 0.02)2 or k = 375,000
Example: Suppose that the specifications for a part (in inches) are 7.00 ± 0.25, and that the Taguchi Loss Function is estimated to be L(x) = 8,500(x-T)2. Determine the estimated loss if the quality characteristic under study takes on a value of 7.50 inches. Is the loss greater at 7.50 as opposed to 7.25? T= 7.00 ; 6.75 < specification range < 7.25, Since the upper limit of specification for the part should be <7.25, a part with x=7.5 is way exceeded that limt. L(x) = 8500 (7.50-7.00)2 = $2125 when x=7.5 inches L(x) = 8500 (7.25 -7)2 = $531.25 when x=7.25 inches
Key Concept: Reliability Management • Reliability is defined as the probability (often expressed as a percentage) that a manufactured good, piece of equipment, or system performs its intended function for a stated period of time under specified operating conditions. • A probability of .97 indicates that on average, 97 out of 100 times the item will perform its function for a given period of time under specified operating conditions • Reliability of a manufactured item depends on the reliability of each component of that system
Components in a Series • A system is composed of a series of individual interrelated components. If any one component fails to perform, the overall system can fail. R1 R2 R3 Component 1 Component 2 Component 3 Formula for series: The whole system reliability Rs = R1 x R2 x R3 R: Reliability of a component
Components in Parallel • To increase the reliability of a system, redundancy is added. The technique is to “back up” with the additional components, putting units in parallel. Only if both components in parallel fail, the entire system will then fail. Component 1 Component 2 Component 3 Component 1 Component 2 R3 R1 R2 Formula for parallel: R1 = 1 – (1- p1) (1- p2)(1-p3)…(1-pn) -if there are n components in parallel In this case, each component 1’s reliability is p1, each component 2’s reliability is p2 Then the total system reliability Rs = R1 x R2 xR3 Rs = [1 – (1- p1) (1- p1)] x [1 – (1- p2) (1- p2)] x R3 Only two parallel components in R1 Only two parallel components in R2
Example: Series Product Reliability The manufacturing of compact disks requires four sequential steps. The reliability of each of the steps is 0.96, 0.87, 0.92, and 0.89 respectively. What is the reliability of the process? Rsystem = (R1)(R2)(R3)……(Rn) RaRbRcRd = (0.96)(0.87)(0.92)(.89) = 0.6839
Example: Parallel Product Reliability The system reliability for a two-component parallel system is 0.99968. If the reliability of the first component is 0.992, determine the reliability of the second component. 0.99968 = 1 – (1 – 0.992)(1 – p2) 0.99968=1-(.008-.008p2) 0.99968-1= -.008+.008p2 p2 = 0.96
Redundancy .91 B A C B .98 .99 .91 • We have both series and parallel components here in this system • RB = 1- (1-0.91)(1-0.91) = 0.9919 (*parallel Rs is always larger than the each individual R in parallel situation) • Rsystem = (0.98) (0.9919)(0.99) = 0.962 or 96.2% (*series Rs is always smaller than each individual R in series situation)
Example: Given the diagram below, determine the system reliability if the individual component reliabilities are: A = 0.94, B = 0.92, C = 0.97, and D = 0.94. A C B D A and B are parallel components RAB = 1 - (1 - 0.94)(1 - 0.92) =.9952 C and D are also parallel components RCD = 1 - (1 - 0.97)(1 - 0.94) = .9982 A-B and C-D are sequentially arranged Rsystem = RABRCD= (0.9952)(0.9982) = 0.9934
Example: What is the reliability of this system? If you could add one process (must be one of the existing processes) to best improve reliability what would be the improved reliability? A B C D 0.987 0.965 0.912 0.988 0.912 The lowest reliability component in this system is C, so we first improve Rc by adding another C in parallel fashion Parallel Reliability = 1- (1-0.912)(1-0.912) = 0.992256 Total System Reliability = (0.987)(0.965)(0.992256)(0.988) =0.9337 C
Key Concepts • Lean Operations/Just In Time The manufacturing and service operations that uses approaches of focusing on the elimination of waste in all forms, and smooth, efficient flow of materials and information throughout the value chain to obtain faster customer response (JIT), higher quality, and lower costs. • Lean concepts were initially developed and implemented by the Toyota Motor Corporation. • Toyota production system (TPS) emphasizes continuous improvement, respect for people and standard work practices. • Lean production supplies the customer with their exact wants when the customer wants it wants it without waste.
Five Basic Lean Principles • Elimination of Waste: Eliminate any activities that do not add value in an organization. Includes overproduction, waiting time, processing, inventory, and motion. • Increased Speed and Response(throughput):Better process designs allow efficient responses to customers’ needs and the competitive environment. Lean/JIT is market driven • Improved Quality (reducing variability):Poor quality creates waste, so improving quality is essential to the lean environment. • Reducing Cost: Simplifying processes and improving efficiency translates to reduced costs. • Maintaining respect for all workers: people, not machines make things happen.
Key concepts: Push Production/Distribution Systems • Apush systemproduces finished goods inventory in advance of customer demand using a forecast of sales. • Parts and subassemblies are “pushed” through the operating system based on a predefined schedule that is independent of actual customer demand. • A traditional automobile factory and distribution system is a good example of a push system.
Just-in-Time Systems (JIT) - Market Driven • In a pull system, employees at a given operation (work station) go to the source of the required parts, such as machining or subassembly, and withdraw the units as they need them • By pulling parts from each preceding workstation, the entire manufacturing process is synchronized to the final-assembly schedule. • Finished goods are made to coincide with the actual rate of customer demand, resulting in minimal inventories and maximum responsiveness.
Just-in-Time Systems (JIT) • JIT systems are sometimes called a Kanban system. • AKanbanis a flag or a piece of paper that contains all relevant information for an order. • Slips, called Kanban cards, are circulated within the system to initiate withdrawal and producing items through the production process. • The Kanban cards are simple visual controls.
Just-in-Time Systems (JIT) • The withdraw Kanban authorizes the material handler to transfer empty containers to the storage area. Next, a production Kanban triggers production of parts. Finally, the full container is delivered to the material handler.
Number of Kanban Cards Required K= d(p + w)(1 + ) C Where: K = the number of Kanban cards in the operating system. d = the average production rate. w = the waiting time of Kanban cards (that is, the time it takes to deliver the container). p = the processing time per container. C = the capacity of a standard container in the proper units of measure (parts, items, etc.). JIT practice is to set the lot size or container size equal to about 5% to 20% of a days demand or between 20 to 90 minutes worth of demand. Also, the container is sized to be able to be moved by the operator without help, if possible. = safety stock as a %, usually ranging from 0 to 1.
Example: Anna works on an assembly line where it takes her 20 minutes to produce 53 units of a product needed to fill a container. It takes her an additional 5 minutes to transport the container to Josh, who works at the next station. The company uses a safety stock of 15%. The current assembly line uses 5 kanbans between Anna's and Josh's stations. What is the demand for the product? • P=20 min, W= 5 min, C=53, =.15, K=5 • Calculate d • K= d(p + w)(1 + ) • C • d(p + w)(1+ ) = KC • d(20+5)(1+.15)=5*53 • d= 9.217 /minute
Example: Computing the Number of Kanbans: an aspirin manufacturer has converted to JIT manufacturing using Kanban containers. They wish to determine the number of containers at the bottle filling operation which fills at a rate of 200 per hour. Each container holds 25 bottles, it takes 30 minutes to receive more bottles (processing plus delivery time) and safety stock is set at 10% .
Key Concepts Location analysis methods • Factor rating method (where to locate a production facility) Six steps: • Develop a list of relevant factors called key success factors • Assign a weight to each factor • Develop a scale for each factor • Score each location for each factor • Multiply score by weights for each factor for each location • Recommend the location with the highest point score
Center-of Gravity Method • Finds location of distribution center that minimizes distribution costs • Considers • Location of markets • Volume of goods shipped to those markets • Shipping cost (or distance)
Center-of Gravity Method • Place existing locations on a coordinate grid Grid origin and scale is arbitrary Maintain relative distances • Calculate X and Y coordinates for ‘center of gravity’ Assumes cost is directly proportional to distance and volume shipped
Center-of Gravity Method • X-coordinate = • Y –coordinate = dix: x-coordinate of location i diy: y-coordinate of location i Qi: Quantity of goods moved to or from location i
Factor Rating Example The owners of Speedy Logistics, a company that provides overnight delivery of documents, are considering where to locate their new facility in the Midwest. They have narrowed their search down to two locations and have decided to use factor rating to make their decision. They have listed the factors they consider important and assigned a factor score to each location based on a 5-point scale 1 lowest, 5 highest). The information is shown here. What is the best location, and what is its factor rating score?
Choose location 1 as its factor rating score is 450, higher than that of location 2.
Center-of Gravity Method Example: find the optimal warehouse location from which deliveries will be made to four locations: Chicago, New York, Pittsburgh and Atlanta. New York (130,130) North-South Chicago (30,120) 120 Chicago (90,110) 90 60 Atlanta (60,40) 30 East-West 30 60 90 120 150
Center-of Gravity Method Store Locations No. of Containers Shipped per Month Chicago (30, 120) 2,000 Pittsburgh (90,110) 1,000 New York (130, 130) 1,000 Atlanta (60,40) 2,000 Let’s find out the location of the warehouse by calculating its x and y Coordinates: (30)(2000)+(90)(1000)+(130)(1000)+(60)(2000) 2000+1000+1000+2000 = 66.7 x= (120)(2000)+(110)(1000)+(130)(1000)+(40)(2000) 2000+1000+1000+2000 = 93.3 y= Answer: the warehouse location is at (66.7, 93.3) or somewhere very close to this.
Key Concepts • Facility Layout Ch 9 p. 344 • Specific arrangement of physical facilities • Good layouts consider • Supporting firm’s core competencies and competitive priorities • Considers material handling equipment, and minimizing delays in materials handling • Capacity and space requirements • Environment and aesthetics • Flow of information • Cost of moving between various work areas • Promote high employee morale and customer satisfaction
Types of Layout Office Supermarket / Retail Warehouse (storage) Project Job Shop (Process oriented) Work Cell (Product families) Repetitive / Continuous (Product oriented)
Process layout design • - Grouping of similar activities or consisting of similar • functional equipments • Pros • General purpose & flexible resources; Flexible and capable of handling a wide variety of products or services • Lower capital/equipment cost • Higher worker satisfaction • Cons • Higher labor cost – workers more skilled • Processing rates are slower • Material handling costs are higher/more WIP • Scheduling resources & work flow is more complex and difficulty • Space requirements are higher • e.g. Legal offices, Hospitals
Process layout design • 3- step process • Gather information: space needed, space available, • importance of proximity between various units • Develop alternative block plans: using trial-and-error • or decision support tools • Develop a detailed layout: consider sizes, shapes of • departments and centers; utilize tools such as 3-D • models and CAD software
2. Product layout design • Arrangement based on the sequence of operations that is performed • Pros • Processing rates are faster • Material handling and labor costs are lower • Less space required for inventories • Cons • High capital cost and wide use of automation • Less volume or design flexibility • Specialized equipment required • Support staff expensive • e.g. automobile assembly lines, wine-making industry
Key Concepts • Study process layout design • Using load-distance score to choose a layout plan • 2. Study product layout • Using Assembly line balancing to design work stations
Product Layout Design Grouping tasks among workstations so that each workstation has –in the ideal case- the same amount of work Step 1: Identify tasks & immediate predecessors Step 2: Calculate the cycle time Step 3: Determine the output rate Step 4: Compute the theoretical minimum number of workstations Step 5: Assign tasks to workstations (balance the line) Step 6: Compute efficiency, idle time & balance delay
Process Layout Example The following from-to matrix shows daily customer trips between departments of Fresh Foods Grocery Their proposed layout looks like the following What is the load-distance for Fresh Foods proposed layout?
1 distance for A-C is 1 distance for C-E is 2 distance for A-E is 3 2 To evaluate multiple layout plans, choose the one with smallest load-distance score- a good proposed layout would require less walking
Product Layout Example The following table shows the tasks required to assemble an aluminum storm door and the length of time needed to complete each task. Total task time: 232 • Calculate the cycle time • What is the maximum output per hour for this line with an operator at each station? • Calculate the minimum number of work stations required and round up • What is the efficiency of the line if the theoretical minimum number of stations is used? Round down. Use the combination of stations shown.
Bottleneck: 70 seconds for each unit locate near E Total task time: 232 Draw the layout first based on the information given: B F A C E H D G • Cycle time – is determined by the bottleneck or station that takes the • longest: 70 sec.
2. 55 B 70 3. 15 A 12 E F C You need 4 workstations G D 20 55 5 H 32 75 55 47 23 Balance the line: (A,D), (B), (C,E,G), (F,H), assign these tasks to 4 work stations
4. After the activities are grouped and assigned to 4 work stations, the new cycle time becomes 75 seconds.
Layout Calculations • Step 2:Determine cycle time • Cycle time is determined by the bottleneck or station that takes the longest • Cycle time = Station A (50 seconds) since it is the bottleneck • Step 3:Determine output rate per hour • (note: always make the units for both available time and bottleneck consistent) • Step 4: Compute the theoretical minimum number of stations • TM = number of stations needed to achieve 100% efficiency (every second is used) • Round up or down depending on circumstances
55 55 55 Balance the line: (A,B), (C,D,G), (E,F,H,I), assign these tasks to 3 work stations
Layout Calculations • Step 6: Compute efficiency, idle time & balance • delay Balance Delay = 1 - Assembly Line Efficiency In this case Balance Delay= 1-1.00 = “0” idle time
Another Line Balancing Problem Total: 20 mins 3.4 mins B E 2.7 mins 2.2 mins A C 4.1mins D 1.7mins F 3.3 mins G 2.6 mins
Before balancing the line, the efficiency is: = (2.2+3.4+4.1+2.7+1.7+3.3+2.6) (100) 4.1x7 =69.7% Balance Delay: 1- 69.7% =30.3%