Download

1 / 24
240 likes | 482 Views
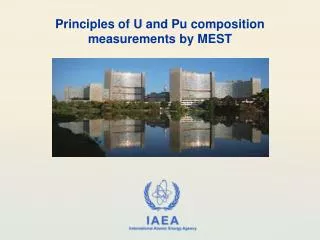
Optimizing Peak Separation for Simultaneous Pu and U Measurements. Shane Knockemus US EPA / NAREL May 3, 2005. Why would anyone be interested in simultaneous determination of Pu and U?. Increased laboratory efficiency due to a higher degree of sample throughput.

E N D
Optimizing Peak Separation for Simultaneous Pu and U Measurements Shane Knockemus US EPA / NAREL May 3, 2005
Why would anyone be interested in simultaneous determination of Pu and U? • Increased laboratory efficiency due to a higher degree of sample throughput. • Laboratory production would be increased. Twice as many alpha spec detectors would be available for use. • Why do something twice when once is enough?
Goal • I hope to show that a simultaneous determination of Pu and U is possible through manipulating important variables. Such variables include: • mass of carrier used during fluoride precipitation • counting the sample at different shelf heights in the alpha spec chamber • type of filter employed.
Pu and U measured simultaneously? • First noticed the possibility after a mistake during sample separation.
Studies have been concentrated on source preparation involving a cerium fluoride coprecipitation. No testing of source preparation with respect to electrodeposition was included in the study.
Experiment parameters • TEVA / TRU separation scheme was used. There are many possible scenarios that could enable simultaneous Pu and U elution. • Pu and U eluted together with ammonium oxalate from TRU. • Pu and U precipitated together in the presence of TiCl3. • 0.2 um filters used during filtration, later Resolve filters were used. • Varying amounts of Ce+3 used. • Varying shelf height in alpha spec chambers.
Full Width Half Maximum (FWHM) • FWHM simply refers to peak width. It is defined as “the width of the distribution at a level that is just half the maximum ordinate (centroid) of the peak.” FWHM is measured in terms of energy (keV) or channel numbers. • Good resolution is a necessity to measurement by alpha spec, and is highly dependent on source preparation and deposition.
FWHM Diagram centroid y y/2 Width of peak in keV at y/2
Carrier mass and FWHM • FWHM values increase with the amount of carrier mass added during fluoride precipitation
Finding the optimum mass of carrier to use • How much does the mass of carrier used during precipitation affect the tracer recovery? • Experiments involving 50-100 ug of Ce all showed consistently high yields, usually 90+%. • Experiments involving 25 ug had yields that were consistent, but were less than yields of those precipitated with 50-100 ug of Ce, usually 75-85% • Some experiments involving 10 ug of Ce were also done. These provided yields that were inconsistent and often very low.
Spectra comparison 200 ug Ce 100 ug Ce
Regions of concern • Listed are nuclides whose energies could possibly overlap without optimum peak separation
Spectrum from 25 ug Ce 25 ug Peak separation is better But still needs improvement zoom
FWHM and peak separation • Good FWHM values do not always translate into adequate peak separation. All FWHM values from this spectrum are less than 80 keV, but peak separation is an obvious problem. Without any peak fitting manipulations, the measured analyte activities would be questionable.
How to improve peak separation? • All of the previous samples were counted on the top shelf in alpha spec chamber. If the shelf height of the sample were lowered, the resolution and peak separation should improve. Doing this would decrease the efficiency. If you can sacrifice some efficiency in exchange for improved peak separation, this may be advantageous.
Bottom shelf spectra 200 ug Ce 100 ug Ce
Does the type of filter used make a difference in peak separation and resolution?
Progression of improvements 100ugCe-high 25ugCe-low-Resolve 100ugCe-low 25ugCe-low
Experiment results • The samples used for the experiments were 1 liter tap water samples and were spiked ‘in house’ with known amounts of activity. • The recoveries of the spiked analytes were very good and in acceptable ranges when the peak separation was adequate. • Experiment scenarios that produced incomplete peak separation of analyte and tracer peaks were a problem to quantify accurately. The use of peak fitting may be a useful tool.
Discussion and conclusion • There are many factors to consider if simultaneous measurement of Pu and U were to become a reality. Experiments showed a noticeable improvement in peak separation. The combination of minimizing the mass of carrier used and counting the sample on a lower shelf was effective, but both of those adjustments also have their drawbacks. Such drawbacks include a decreased counting efficiency and a slightly lower yield.