Download
1 / 10
100 likes | 234 Views
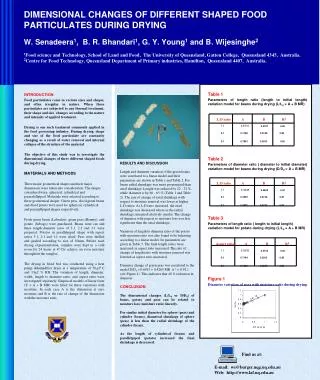
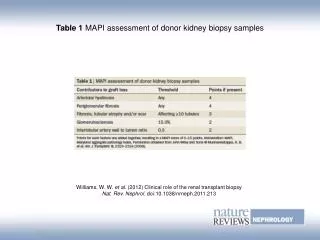
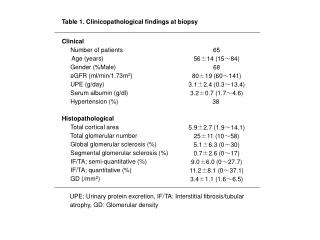
Table 1. Clinicopathological findings at biopsy. Clinical Number of patients Age (years) Gender (%Male) eGFR (ml/min/1.73m 2 ) UPE (g/day) Serum albumin (g/dl) Hypertension (%) Histopathological Total cortical area Total glomerular number

E N D
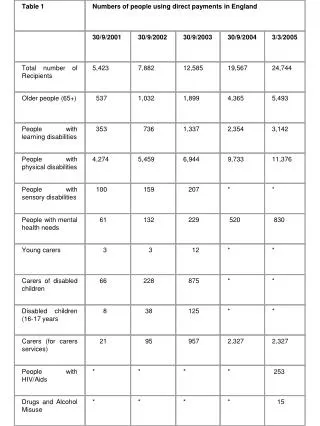
Table 1. Clinicopathological findings at biopsy Clinical Number of patients Age (years) Gender (%Male) eGFR (ml/min/1.73m2) UPE (g/day) Serum albumin (g/dl) Hypertension (%) Histopathological Total cortical area Total glomerular number Global glomerular sclerosis (%) Segmental glomerular sclerosis (%) IF/TA; semi-quantitative (%) IF/TA; quantitative (%) GD (/mm2) 65 56±14 (15~84) 68 80±19 (60~141) 3.1±2.4 (0.3~13.4) 3.2±0.7 (1.7~4.6) 38 5.9±2.7 (1.9~14.1) 25±11 (10~58) 5.1±6.3 (0~30) 0.7±2.6 (0~17) 9.0±6.0 (0~27.7) 11.2±8.1 (0~37.1) 3.4±1.1 (1.6~6.5) UPE: Urinary protein excretion, IF/TA: Interstitial fibrosis/tubular atrophy, GD: Glomerular density
Table 2. Clinical findings during the follow-up Duration of follow-up (years) Therapies during the follow-up Immunosuppressants (%) ACE-I/ARB (%) Last observation UPE (g/day) UPE >1g/day (%) eGFR (ml/min/1.73m2) ⊿eGFR (%/years) > 50% reduction in eGFR (%) ESRD (%) 8.1±3.8 (5~24) 42 86 1.7±2.5 (0.0~9.2) 40 61±28 (3~129) -3.8±5.6 (-32.8~2.8) 15 8 UPE: Urinary protein excretion, ESRD: End-stage renal disease
Table 3. Comparison of the clinicopathological findings and renal outcome between the patients with lower GD (<3.1 /mm2) and those with higher GD (>3.1 /mm2) GD <3.1/mm2 (n= 33) 55±14 80±21 3.2±2.2 33 33 6.1±5.6 1.2±3.6 9.3±5.4 12.1±7.7 7.8±3.4 42 88 55 -5.4±6.9 27 GD >3.1 /mm2 (n=32) 56±14 79±17 3.0±2.5 31 41 4.1±6.8 0.2±0.9 8.6±6.1 10.2±8.6 8.4±4.2 41 81 25 -2.2±3.5 3 P value 0.748 0.942 0.778 0.857 0.543 0.059 0.232 0.244 0.151 0.586 0.883 0.459 0.015 0.034 0.007 At biopsy Age eGFR (ml/min/1.73m2) UPE (g/day) UPE >3.5g/day (%) Hypertension (%) Global glomerular sclerosis (%) Segmental glomerular sclerosis (%) IF/TA; semi-quantitative (%) IF/TA; quantitative (%) Follow-up Duration of follow-up Therapies during the follow-up Immunosuppressants (%) ACE-I/ARB (%) Last observation UPE >1g/day (%) ⊿eGFR (%/years) >50% reduction in eGFR or ESRD (%) UPE: Urinary protein excretion, IF/TA: Interstitial fibrosis/tubular atrophy, ESRD: End-stage renal disease.
Table 4. Factors at biopsy influencing slope in renal function (⊿eGFR) by univariate and multivariate regression analyses Univariate Multivariate Variables Age (years) eGFR (ml/min/1.73m2) MAP (mmHg) UPE (g/day) * * Serum albumin (g/dl) Global glomerular sclerosis (%) ** Segmental glomerular sclerosis (%) * IF/TA; quantitative (%) GD (/mm2) r -0.200 0.145 -0.134 -0.112 0.130 -0.134 -0.119 0.127 0.319 p 0.110 0.249 0.288 0.375 0.303 0.286 0.345 0.313 0.010 t -1.114 0.259 -0.532 -0.609 0.678 0.259 -0.529 0.313 2.286 p 0.270 0.797 0.597 0.545 0.501 0.796 0.599 0.755 0.026 MAP: Mean arterial pressure, UPE: Urinary protein excretion, IF/TA: Interstitial fibrosis/tubular atrophy, GD: Glomerular density, * Variables were log-transformed before analysis.
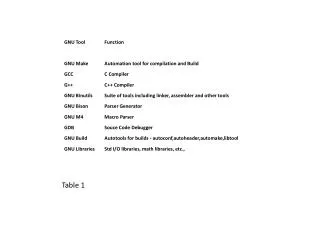
Patients with >50% reduction in eGFR or ESRD % 60 50 40 30 20 10 0 • 15 8 24 Number of patients + - + - Proteinuria >1g/day at follow-up Lower (3.1>) Higher (3.1< ) GD (mm2) Figure 1
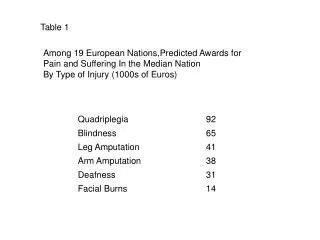
Figure 2 10 0 -10 ⊿eGFR (%/yr) -20 n=65 r=0.319 p=0.010 -30 -40 0 1 2 3 4 5 6 7 8 GD (/mm2)
Table S1. Comparison of the clinicopathological findings and renal outcome between the patients with lower GD (<3.1 /mm2) and those with higher GD (>3.1 /mm2) treated with immunosupplessants GD<3.1/mm2 (n= 14) 58±8 75±12 57 21 6.1±5.2 2.0±5.2 10.6±6.4 13.9±6.9 7.5±2.9 100 93 64 -7.2±4.9 43 GD>3.1 /mm2 (n=13) 53±13 79±14 46 54 2.5±3.4 0.2±0.8 8.5±6.4 9.8±9.1 8.6±5.3 100 85 31 -3.0±4.9 8 P value 0.550 0.402 0.568 0.081 0.054 0.756 0.302 0.038 0.943 - 0.456 0.082 0.009 0.037 At biopsy Age eGFR (ml/min/1.73m2) UPE >3.5g/day (%) Hypertension (%) Global glomerular sclerosis (%) Segmental glomerular sclerosis (%) IF/TA; semi-quantitative (%) IF/TA; quantitative (%) Follow-up Duration of follow-up Therapies during the follow-up Immunosuppressants (%) ACE-I/ARB (%) Last observation UPE >1g/day (%) ⊿eGFR (%/years) >50% reduction in eGFR or ESRD (%) UPE: Urinary protein excretion, IF/TA: Interstitial fibrosis/tubular atrophy, ESRD: End-stage renal disease
Table S2. Glomerular density and renal outcome in relation to interstitial fibrosis and segmental glomerular sclerosis Interstitial fibrosis/ tubular atrophy >10% (n=34) <10% (n=31) >20% (n=10) <20% (n=55) Segmental glomerular sclerosis Present (n=7) Absent (n=58) GD ( /mm2) 3.0±0.7 3.8±1.2 2.8±1.0 3.5±1.1 3.1±1.2 3.4±1.1 p value 0.010 0.037 0.478 >50% reduction in eGFR (%) 21 10 30 13 29 16 p value 0.223 0.164 0.384 ⊿eGFR (%/year) -4.5±4.9 -3.0±6.4 -5.0±4.2 -3.6±5.9 -4.6±5.2 -3.7±5.7 p value 0.136 0.260 0.682
40 35 30 25 20 15 IF/TA quantitative (%) 10 n=65 r=0.781 P<0.0001 5 0 -5 -5 0 5 10 15 20 25 30 IF/TA semi-quantitative (%) Figure S1
Figure S2 8 7 /m2 6 5 4 3 Glomerular density (simple measuring) 2 n=65 r=0.888 p<0.0001 1 1 2 3 4 5 6 7 /m2 Glomerular density (imaging analysis)