Download
1 / 15
150 likes | 170 Views
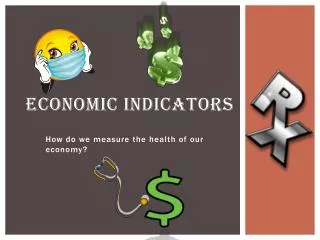
Equip students with tools to analyze economic data like inflation, growth, interest rates, focusing on fiscal, monetary, and trade indicators. Covers descriptive statistics, SPSS usage, index numbers, regression, Chi-Square & correlation analysis.

E N D
INTT 103Economic Statistics and Indicators Prof. Dr. MahirNakip International Trade Department mnakip@cankaya.edu.tr
Teaching Sources Main Source: STATISTICS FOR ECONOMISTS: A BEGINNING John E. Floyd University of Toronto July 2, 2010
Second Source: IBM SPSS Statistics 23 Brief Guide
2. Supporting Source: Marketing Research an AppliedApproach NareshMalhotraand David F. Birks Second EuropeanEdition, 2006
3. Auxiliary Source: Pazarlamada Araştırma Teknikleri Prof. Dr. Mahir Nakip Seçkin Yayın Evi Üçüncü Baskı, 2013
Description of this course… This course is to provide students with the necessary toolkit (araç)to analyze and extract information from economic indicators and statistics. There are huge amounts of numerical data in economics such as inflation, growth, interest rates and so on. These data must be analyzed in order to extract the necessary information to guide decisions. We will concentrate on economic indicators to include fiscal, monetary and trade (i.e, the balance of payment accounts, exchanges rates etc.) indicators in this course.
This Course Gives What to the Students? Some basic information about classification of the statistical variables and statistical methods Calculating and using descriptive statistics in economics and business Using SPSS in calculating descriptive statistics Using SPSS to draw statistical graphs How to use or calculate ındex numbers in economical data base How to use regression analysis in economics and business sciences by using SPSS How to use Qi Square analysis in business by using SPSS How to use correlation analysis in economics and business sciences by SPSS
Mid term exam Style: Classic, 10-14 questions Weight: 30% Final exam Style: classic, 10-14 questions Weight: 50% Assignmentandpresentation Style: Shortessay, solvingstatisticalproblems, shortresearchpaperandgrouppresentation Weight: 20%
Office Hours: Monday: 10.00-12.00 Wednesday: 10.00-12.00 and 14.00-16.00 Grading Policy: 30% Midterm exam 20% Assignment and presentation 50% Final Exam
The main objectives of this course are 1. Understanding of the main concepts, indicators and statistics employed within the field of economics. 2. Ability to a. Understand and interpret economic information presented in textual, numerical or graphical form b. Select and apply economic concepts and principles to explain and analyze contemporary events at the micro and macro levels c. Make interpretations and valid inferences from information presented and evaluate the reliability of information given d. Organize and communicate economic ideas and arguments in a clear, logical and appropriate form.