Download
1 / 49
500 likes | 678 Views
Cross-layer Optimized Placement and Routing for FPGA Soft Error Mitigation. Keheng Huang 1,2 , Yu Hu 1 , and Xiaowei Li 1 1 Key Laboratory of Computer System and Architecture Institute of Computing Technology Chinese Academy of Sciences 2 Graduate University of Chinese Academy of Sciences.

E N D
Cross-layer Optimized Placement and Routing for FPGA Soft Error Mitigation Keheng Huang1,2, Yu Hu1, and Xiaowei Li1 1Key Laboratory of Computer System and ArchitectureInstitute of Computing Technology Chinese Academy of Sciences 2Graduate University of Chinese Academy of Sciences
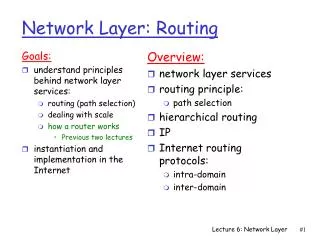
Outline • Background • Motivation • Cross-layer optimized placement and routing • Experimental results • Conclusions
Background • Architecture of SRAM-based FPGAs
Background • Architecture of SRAM-based FPGAs Segments
Background • Architecture of SRAM-based FPGAs Segments
Background • Architecture of SRAM-based FPGAs • Configuration bits (>98% of all SRAM bits) • Routing resources (80% of configuration bits) • User bits (<2% of all SRAM bits) Segments • The reliability of routing resources needs to be seriously considered during placement and routing
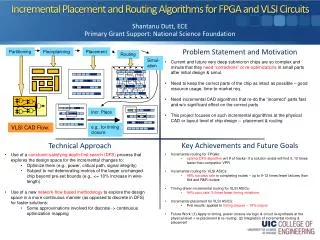
Reliability Oriented EDA Flow Design specification • Application design level • Physical design level Synthesis and mapping • RoRA[TC’06] • TMR designs only Gate-level netlist • SEU-Aware P & R[ISQED’07] • Dimensions of bounding box • SEU-Aware Router [DAC’07] • Number of configuration bits Placement and routing • Reliability-aware P & R[ITC’10] • Dimensions of bounding box Bit Stream
Soft Error Rate (SER) SER evaluation criterion Application level factor (EPP) Propagation probability + Physical level factor • (Node error rate) Occurrence probability
Key Observation Prior P& R guidance criterion SER evaluation criterion Application level factor (EPP) All EPPs are equal? + Estimated SER Physical level factor • (Node error rate) Physical level factor (Bounding boxes, Configuration bits)
Key Observation • Application level factor (EPPs) varies significantly
Key Observation • Application level factor (EPPs) varies significantly
Cross-layer Optimized Placement and Routing • Overview
Cross-layer Optimized Placement and Routing • Overview
Cross-layer Optimized Placement and Routing • Overview
Cross-layer Optimized Placement and Routing • Overview
Cross-layer Optimized Placement and Routing • Overview
Cross-layer Optimized Placement and Routing • Overview
Cube-based EPP Analysis • Error propagation probability (EPP) • Monte Carlo simulation • Test vectors (high accuracy) • Traverse the design N times (high complexity) • Static analysis • Signal probability and error propagation rules (lower accuracy) • Traverse the design twice per fault (lower complexity)
Cube-based EPP Analysis • Error propagation probability (EPP) • Monte Carlo simulation • Test vectors (high accuracy) • Traverse the design N times (high complexity) • Static analysis • Signal probability and error propagation rules (lower accuracy) • Traverse the design twice per fault (lower complexity) • A method with high accuracy and low complexity?
Cube-based EPP Analysis • Besides 0 and 1, “X” bit is introduced • Introduce the cube and cover in logic synthesis • Covers adjoin V:(set union:∪) • Covers interface I:(set intersection: ∩) 0XX = {000,001,010,011} cube cover ={0XX, 1XX} adjoin :{00X} V {01X} = {0XX} interface: {00X} I {001} = {001}
Cube-based EPP Analysis • Forward traverse: compute the vectors that set the logic of the wire as 0 and 1 respectively
Cube-based EPP Analysis • Forward traverse: compute the vectors that set the logic of the wire as 0 and 1 respectively
Cube-based EPP Analysis • Forward traverse: compute the vectors that set the logic of the wire as 0 and 1 respectively • Backward traverse: compute the vectors that can propagate the fault to outputs
Cube-based EPP Analysis • Forward traverse: compute the vectors that set the logic of the wire as 0 and 1 respectively • Backward traverse: compute the vectors that can propagate the fault to outputs
Application level factor • Error propagation probability (EPP) • Compare with traditional Monte Carlo simulation • For each fault, traverse the design N times Ncare-cover: number of vectors stored in care-cover Ninputs: total number of input vectors
Application level factor • Comparison of computational complexity • N: number of input vectors • V: number of LUTs • E: number of interconnecting wires • g: number of configuration bits per LUT or wire • Cavg: average compression ratio of all covers
Cross-layer Optimized Placement Total cost=a*timing cost + b*congestion cost + c*SER cost SER cost= Phy cost * App cost
Cross-layer Optimized Placement Total cost=a*timing cost + b*congestion cost + c*SER cost SER cost= Phy cost * App cost
Cross-layer Optimized Placement Total cost=a*timing cost + b*congestion cost + c*SER cost SER cost= Phy cost * App cost
Cross-layer Optimized Placement Total cost=a*timing cost + b*congestion cost + c*SER cost SER cost= Phy cost * App cost
Cross-layer Optimized Placement Total cost=a*timing cost + b*congestion cost + c*SER cost SER cost= Phy cost * App cost
Cross-layer Optimized Placement Total cost=a*timing cost + b*congestion cost + c*SER cost SER cost= Phy cost * App cost
Cross-layer Optimized Placement Total cost=a*timing cost + b*congestion cost + c*SER cost SER cost= Phy cost * App cost
Cross-layer Optimized Routing • Finer granularity estimate of SER
Cross-layer Optimized Routing • Finer granularity estimate of SER
Cross-layer Optimized Routing • Finer granularity estimate of SER
Cross-layer Optimized Routing • Finer granularity estimate of SER
Cross-layer Optimized Routing • Finer granularity estimate of SER
Cross-layer Optimized Routing • Finer granularity estimate of SER
Experimental Setup MCNC benchmark set • Berkeley ABC mapper Logic resources: 4 6-input LUTs per CLB Routing channel width: 30% increase Gate-level netlist • VPR: Academic FPGA placement and routing tool Bit Stream
Experimental results • Comparison of EPP accuracy and run time • Monte Carlo simulation • DCOW: partial Monte Carlo simulation • Cube-based EPP analysis • Comparison of SER mitigation • Original VPR • Guided by physical level factor only (PPL) • Cross-layer optimized placement and routing algorithm (COPAR)
Comparison of EPP Accuracy and Run Time • Monte Carlo simulation (golden model) • DCOW: partial Monte Carlo simulation (DAC’10) • Cube-based analysis (our method) Ncube: number of test vectors computed by cube-based analysis Nsim: number of test vectors computed by Monte Carlo simulation Ninputs: total number of input vectors
Comparison of SER Mitigation 100% 93.53% 85.61%
Conclusions • Observe the gap between the SER evaluation criterion and guidance criterion for soft error mitigation (gini coefficient=0.646) • Introduce cube-based EPP analysis to compute the application level factor (gap<1%) • Propose a cross-layer optimized placement and routing algorithm (SER mitigation>14%)
Thank You for Your Attention • Question?