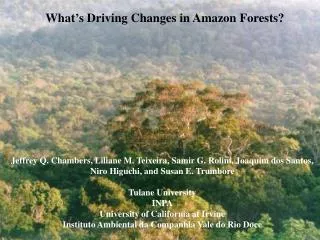
What’s Driving Changes in Amazon Forests?
240 likes | 362 Views
What’s Driving Changes in Amazon Forests?. Jeffrey Q. Chambers, Liliane M. Teixeira, Samir G. Rolim, Joaquim dos Santos, Niro Higuchi, and Susan E. Trumbore Tulane University INPA University of California at Irvine Instituto Ambiental da Companhia Vale do Rio Doce.

What’s Driving Changes in Amazon Forests?
E N D
Presentation Transcript
What’s Driving Changes in Amazon Forests? Jeffrey Q. Chambers, Liliane M. Teixeira, Samir G. Rolim, Joaquim dos Santos, Niro Higuchi,and Susan E. Trumbore Tulane University INPA University of California at Irvine Instituto Ambiental da Companhia Vale do Rio Doce
Changing Dynamics of Tropical Forests Phillips, O. L., and A. H. Gentry. 1994. Increasing turnover through time in tropical forests. Science 263:954-958. (Also Phillips et al. 2004) Phillips, O. L et al.. 1998. Changes in the carbon balance of tropical forests: evidence from long-term plots. Science 282:439-442. (Also Baker et al. 2004) Phillips, O. L. et al. 2002. Increasing dominance of large lianas in Amazonian forests. Nature 418:770-774. Laurance, W.F. et al. 2004. Pervasive alteration of tree communities in undisturbed Amazonian forests. Nature 428 171-175 Forest turnover (recruitment + mortality) doubled from 1975-1990 Tree biomass has increased in Neotropics since 1980 at about 0.5 Mg C ha-1 yr-1 Relative dominance of lianas/trees has doubled over the past 20 years Changes widely cited as driven by increasing atmospheric CO2 What is causing this non-equilibrium behavior?
Modeling Forest Size Structure Tree Stand Log[growth rate (cm yr-1)] Plot 20 m Chambers, J. Q. et al. (in press) Response of tree biomass and wood litter to disturbance in a Central Amazon forest. Oecologia.
Tree Species Diversity and Forest Structure p = 0.01 n = 220
Species Matter without species with species Forest biomass distribution predicted much better with species information on maximum size What happens as individual trees reach their species size limits?
Coarse Litter Decomposition Study Mortality records from 21 ha of permanent inventory data stratified by wood density and trunk diameter 155 trees, dead for 3-15 years, remains located in the field Three cross-sections removed from each dead tree Coarse litter comprises trunks and branches > 10 cm diameter
Calculating Decomposition Rates t1 t0 mass0 = r2h mass1 = weight - moisture Decomposition rate constant: kd = ln(m1/m0)/(t1-t0) Quantitative coarse litter decomposition model: Decomposition includes respiration, leaching and fragmentation Chambers, J. Q., N. Higuchi, L. V. Ferreira, J. M. Melack, and J. P. Schimel. 2000. Decomposition and carbon cycling of dead trees in tropical forests of the central Amazon. Oecologia 122:380-388.
Modeling Coarse Litter Decomposition and Respiration 80% 20% Chambers, J. Q., N. Higuchi, L. V. Ferreira, J. M. Melack, and J. P. Schimel. 2000. Decomposition and carbon cycling of dead trees in tropical forests of the central Amazon. Oecologia 122:380-388. Chambers, J. Q., J. P. Schimel, and A. D. Nobre. 2001c. Respiration from coarse wood litter in central Amazon forests. Biogeochemistry 52:115-131.
Comparison of Field Data and Model Predictions Summers, P. M. 1998. Estoque, Decomposição e Nutrients da Liteira Grossa em Floresta de Terra-Firme, na Amazônia Central. MS thesis. Instituto Nacional de Pesquisas da Amazônia, Manaus, Brasil. Chambers, J. Q., N. Higuchi, and J. P. Schimel. 1998. Ancient trees in Amazonia. Nature 391:135-136. Chambers, J. Q., T. Van Eldik, J. Southon, and N. Higuchi. 2001. Tree age structure in tropical forests of Central Amazonia. Pages 68-78 in R. O. J. Bierregaard, C. Gascon, T. E. Lovejoy, and R. C. G. Mesquita, editors. Lessons from Amazonia. Yale Univeristy Press, New Haven.
Carbon Cycling Structure of the Model CO2 CO2 respiration growth mortality live wood wood litter fragmentation recruitment total wood This stochastic-empirical forest inventory model can be used to explore how changes affecting individual trees influences ecosystem scale carbon cycling and storage.
The carbon sequestration potential of wood Model experiment: how does carbon balance respond to a large increase in productivity? Productivity increased as a function of the known and expected increase in atmospheric CO2. The slope of the response evident by 2010-2020 probably represents a large portion of forest long-term carbon sequestration potential Chambers, J. Q., and W. L. Silver. 2004. Some aspects of ecophysiological and biogeochemical responses of tropical forests to atmospheric change. Philosophical Transactions of the Royal Society of London, Series B 359:463-476.
Tree biomass response to various beta factors The slope of these responses from 1980-2020 (generously corresponding to pan-Amazonian forest inventory census) varied from 0.05-0.51 Mg C ha-1 yr-1. Only a very large b, corresponding to a 100% increase in wood productivity with CO2 doubling, agrees with forest inventory data.
Modeling Carbon Cycling Dynamics Across the Basin Actual biomass range (green ellipse) considerably lower than model predictions, suggesting productivity/turnover envelope may be too large, or other factors. Malhi, Y.et al. 2004. The above-ground wood productivity and net primary productivity of 100 neotropical forests. Global Change Biology 10:563-591.
Predicted Carbon Fertilization Sink Potential 1980-2020 Based on 100 ha model runs, sink potential showed no correlation with increased growth rate because more productive forests also exhibit greater variability in mortality. Simulated CO2 fertilization (based on 25% increase in NPP w/ 2xCO2) clearly evident when mortality variability shut off.
Catastrophic and Background Mortality Permanent plot data provide information on background mortality What is the effect of infrequent high mortality years on forest carbon balance? Little information on frequency and extent 200 m Severe downburst winds associated with late dry season storms
E Bloco 2 S T1 N T2 T0 Bloco 4 T3 W T3 T2 T1 T1 T0 A T2 Bloco 1 T0 Km-22 Vicinal ZF-2 T3 Km-23 Escala 1: 20.000 Response to Disturbance: BIONTE Logging Experiment Permanent Plots T0: control plots (3 ha) T1: 32% basal area extraction (3 ha) T2: 42% basal area extraction (3 ha) T3: 69% basal area extraction (3 ha) Catastrophic mortality results in a large shift in woody biomass from live to dead pools. It also results in an increase for many years in average growth rates for surviving trees from competitive release.
Growth Response of Surviving Trees Following Catastrophic Mortality This response best modeled assuming exponential decline in growth rate back to pre-disturbance rate (1.1 mm yr-1) Interestingly, the “control” plots showed a similar decline, but with a lower initial growth rate (Go). Tree growth rate response to disturbance is large (e.g. 4x w/ 30% biomass loss), with a rapid recovery (-0.207) to pre-disturbance levels.
Carbon Balance and High Mortality Event Model Simulations A 10% mortality event in 1975 results in an increase in above-ground tree biomass following event at a rate of 0.5-0.7 Mg C ha-1 yr-1(a). However if total large wood (TLW, b-upper) carbon balance is considered, sum of both live (b-lower) and dead (c), the ecosystem roughly maintained carbon balance throughout the disturbance event Changes in disturbance frequency can also have large impacts on tree species composition
El Niño Drought, Biomass Collapse and Recovery Tropical forests may be continually changing over time aggrading in biomass and slowly changing in species composition. Occasional high mortality events (not necessarily linked to El Niño) result in rapid biomass loss followed by slow recovery, with overall carbon balance over large temporal and spatial scales. Rolim S, Nascimento H, Jesus, R. Chambers, J . (in revision) Biomass Change in Atlantic tropical moist forest: the ENSO effect in permanent sample plots over a 22-year period. Oecologia
Tree Biomass Response to Increased Turnover, Changing Species Composition, and Elevated Growth Rates Biomass response to elevated turnover (tree recruitment and mortality) increases of 25%, 50%, and 100% (a). Combined effects: 50% turnover increase, average wood density of recruits from 0.70 to 0.60 g cm-3, and increased growth rates of 25%, 50%, and 75% (b). Changes in tropical forest biomass during the 21st century will depend in large part on tree growth rates response to elevated turnover
Systematic Error Scaling from Diameter to Biomass ln(Biomass)= –0.37 + 0.333·ln(DBH) + 0.933·ln(DBH)2– 0.122·ln(DBH)3 Always results in positive error in biomass growth rate estimates – SD of measurement error not well characterized and probably varies among individuals.
Discussion • Higher growth rates in more dynamic forest results in a larger potential CO2 fertilization sink. However, more dynamic forests exhibit higher mortality variability, and CO2 fertilization sink thus buried in more noise. • Using published variability in turnover and growth rates, a maximum CO2 fertilization sink in Amazonian forests of 0.10 to 0.25 Mg C ha-1 yr-1 is quite difficult to measure directly from 1980-2020. (Unless of course tropical forests are responding physiologically much different that experimental evidence suggests – e.g. Duke FACE experiment) • A measurable fertilization sink is even more difficult to understand given an observed doubling of turnover rates (~1970-1990) – which acts to strongly drive biomass down. • A number of other factors can lead to short-term apparent increases in forest biomass including: (1) spatial and temporal variability in tree mortality rates (and subsequent growth response), (2) variability in other driving factors (e.g. light, moisture, temperature, aerosols, etc., (3) measurement errors including unbalanced scaling diameter to biomass. • Because observed tropical forests changes are likely transitory, and the pan-Amazonian CO2 sink potential is low (or zero), old-growth forest sink does not balance land-use source (although surprises still possible). • Funding priority to expand and intensify research on forest inventory plot networks such as RAINFOR toward resolving these issues.
Acknowledgments Instituto Nacional de Pesquisas da Amazônia (INPA) NASA LBA-ECO Project Piculus (Pilot Programs of the G7 Nations) The Smithsonian Institution: Biological Dynamics of Forest Fragments Project Japanese International Cooperation Agency (JICA)