Download
1 / 20
210 likes | 422 Views
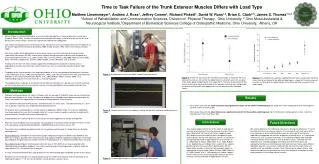
Characterization of Central Activation and Contractile Properties of Lumbar Extensor Muscles. Rachel Ruggeri, SPT. Ohio University Motor Control Lab Dr. David Russ Ph.D., P.T. Stephanie Gustwiller, SPT Dr. James Thomas, Ph.D., P.T.

E N D
Characterization of Central Activation and Contractile Properties of Lumbar Extensor Muscles Rachel Ruggeri, SPT Ohio University Motor Control Lab Dr. David Russ Ph.D., P.T. Stephanie Gustwiller, SPT Dr. James Thomas, Ph.D., P.T.
Characterization of Skeletal Muscle Through Electrical Stimulation • Commonly reported measurements 1. Central Activation 2. Force Frequency Relationship
Central Activation • Ability of the CNS to activate a particular muscle ( ) • One method to asses central activation: • Brief, supramaximal stimulation train delivered during MVC • Central Activation Ratio: Stackhouse et. al, Muscle and Nerve 2000 MVIC Force MVIC + stim force Kent-Braun et. al, Muscle & Nerve 1996
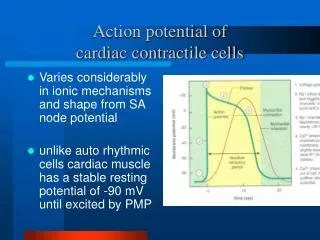
Force Frequency Relationship • Alteration in muscle force with change in activation frequency of motor units ( ) • Analogous to rate coding • Sigmoid relationship observed in single muscle fibers, single motor units, and entire muscle • Absolute number values will vary Lee et al., Encyclopedia of Neuroscience, Binder, Hirokawa, Windhorst (Eds.) 2009.
Application of Central Activation and FFR • Changes in central activation and FFR occur with: • Aging - Disease • Disuse - Trauma • Fatigue • At present measurements have been reported within peripheral skeletal muscle only
Intent of Present Research • Develop a testing methodology within the back extensors to assess: • Central Activation • Force Frequency Relationship • Establish baseline normative values
Methods • Determining maximum stimulated force: • Stim intensity increased by 1 mA increments until force plateau achieved • This intensity used for all central activation trials • Intensity producing 50% of max stimulated force used for force frequency trials
80 70 60 50 40 30 20 10 0 1 2 3 4 5 6 Central Activation • Raw data demonstrating central activation impairment: CAR = 0.81 MCIV + stim MVIC Force (MVIC + stim Force) CAR = Force (lbs) Time (sec)
Central Activation • Back extensors: • Mean CAR = 0.95 (SD = 0.06) • CAR values of other young, healthy muscle groups: • Dorsiflexors: CAR = 0.96 (SD = 0.02) • Quadriceps: CAR = 0.98 (SD = 0.02) • UE? Biceps: CAR = 100 (SD = 0.3%) (Kent – Braun, Muscle & Nerve 1996) (Stevens et. al, Arch Phys Med Rehabil Vol 82, 2001)
Hill Equation Force Frequency Relationship • Typical raw data from a single subject
Force Frequency Relationship • Graph of our F50 vs other people’s F50 y = y0 + [(axb)/(cb + xb)] y = peak F x = frequency Y0 = minimum peak a = scaling factor c = frequency at which 50% of max peak F is produced b = slope
F50 Values • Back extensor mean F50: 16.40 (SD = 3.15) • F50 values measured in other young, healthy muscle groups: • Dorsiflexors: 14 Hz (Mela et. al, Journal of Electromyography and Kinesiology, 2001) • Quads: 12-13 Hz (Allman et. al, Journal of Applied Physiology, 2004) • Biceps: • Hand intrinsics:
Adverse Response to Stimulation • Episodes of syncope in 2 subjects • Abnormal response to increased stimulation amplitude
F50 Values • Mean F50: 16.40 (SD = 3.15) • Similar value to other lower • extremity muscle groups
Hill Coefficient Values • Mean Hill Coefficient: 2.21 (SD = 0.50) • Slope steepness corresponds to rate coding
CAR Data Mean CAR: 0.95 (SD = 0.06)
Future Research Opportunities • Examine central activation and FFR among low back pain populations