Download
1 / 1
10 likes | 133 Views
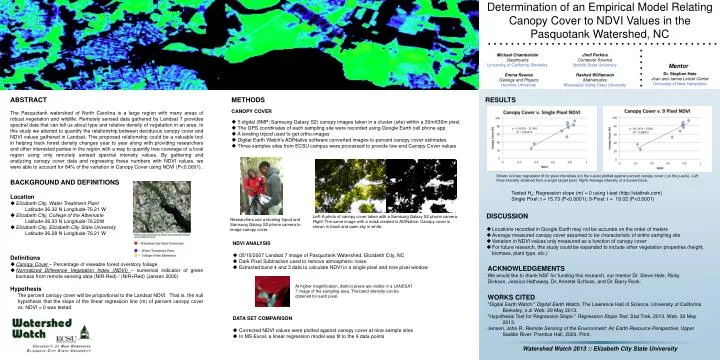
Determination of an Empirical Model Relating Canopy Cover to NDVI Values in the Pasquotank Watershed, NC. Jimil Perkins Computer Science Norfolk State University. Michael Chamberlain Geophysics University of California, Berkeley. Dr. Stephen Hale Joan and James Leitzel Center

E N D
Determination of an Empirical Model Relating Canopy Cover to NDVI Values in the Pasquotank Watershed, NC Jimil Perkins Computer Science Norfolk State University Michael Chamberlain Geophysics University of California, Berkeley Dr. Stephen Hale Joan and James Leitzel Center University of New Hampshire Mentor Emma Reeves Geology and Physics Hamline University Rashad Williamson Mathematics Mississippi Valley State University ABSTRACT The Pasquotank watershed of North Carolina is a large region with many areas of robust vegetation and wildlife. Remotely sensed data gathered by Landsat 7 provides spectral data that can tell us about type and relative density of vegetation in an area. In this study we attempt to quantify the relationship between deciduous canopy cover and NDVI values gathered in Landsat. This proposed relationship could be a valuable tool in helping track forest density changes year to year along with providing researchers and other interested parties in the region with a way to quantify tree coverage of a local region using only remotely sensed spectral intensity values. By gathering and analyzing canopy cover data and regressing these numbers with NDVI values, we were able to account for 84% of the variation in Canopy Cover using NDVI (P<0.0001). RESULTS • METHODS • CANOPY COVER • 5 digital (8MP; Samsung Galaxy S2) canopy images taken in a cluster (site) within a 30mX30m pixel. • The GPS coordinates of each sampling site were recorded using Google Earth cell phone app • A leveling tripod used to get ortho-images • Digital Earth Watch’s ADINativesoftware converted images to percent canopy cover estimates • Three samples sites from ECSU campus were processed to provide low-end Canopy Cover values Shown is linear regression fit for pixel intensities (on the x-axis) plotted against percent canopy cover ( on the y-axis). Left: Pixel intensity obtained from a single target pixel. Right: Average intensity of a 9-pixel block. • BACKGROUND AND DEFINITIONS • Location • Elizabeth City, Water Treatment Plant • Latitude-36.32 N Longitude-76.21 W • Elizabeth City, College of the Albemarle • Latitude-36.33 N Longitude-76.22W • Elizabeth City, Elizabeth City State University • Latitude-36.28 N Longitude-76.21 W • Definitions • Canopy Cover – Percentage of viewable forest overstory foliage • Normalized Difference Vegetation Index (NDVI)– numerical indicator of green biomass from remote sensing data (NIR-Red) / (NIR+Red) (Jansen 2000) • Hypothesis • The percent canopy cover will be proportional to the Landsat NDVI. That is, the null hypothesis that the slope of the linear regression line (m) of percent canopy cover vs. NDVI = 0 was tested. Tested Ho: Regression slope (m) = 0 using t-test (http://stattrek.com) Single Pixel: t = 15.73 (P<0.0001); 9-Pixel: t = 19.02 (P<0.0001) • DISCUSSION • Locations recorded in Google Earth may not be accurate on the order of meters • Average measured canopy cover assumed to be characteristic of entire sampling site • Variation in NDVI values only measured as a function of canopy cover • For future research, this study could be expanded to include other vegetation properties (height, biomass, plant type, etc.) Left: A photo of canopy cover taken with a Samsung Galaxy S2 phone camera. Right: The same image with a mask created in ADINative. Canopy cover is shown in black and open sky in white. Researchers use a leveling tripod and Samsung Galaxy S2 phone camera to image canopy cover. • NDVI ANALYSIS • 05/15/2007 Landsat 7 image of Pasquotank Watershed, Elizabeth City, NC • Dark Pixel Subtraction used to remove atmospheric noise • Extracted band 4 and 3 data to calculate NDVI in a single pixel and nine pixel window • DATA SET COMPARISON • Corrected NDVI values were plotted against canopy cover at nine sample sites • In MS-Excel, a linear regression model was fit to the 9 data points ACKNOWLEDGEMENTS We would like to thank NSF for funding this research, our mentor Dr. Steve Hale, Ricky Dickson, Jessica Hathaway, Dr. Annette Schloss, and Dr. Barry Rock. At higher magnification, distinct pixels are visible in a LANDSAT 7 image of the sampling area. The band intensity can be obtained for each pixel. WORKS CITED "Digital Earth Watch." Digital Earth Watch. The Lawrence Hall of Science, University of California Berkeley, n.d. Web. 29 May 2013. "Hypothesis Test for Regression Slope." Regression Slope Test. Stat Trek, 2013. Web. 30 May 2013. Jensen, John R. Remote Sensing of the Environment: An Earth Resource Perspective. Upper Saddle River: Prentice Hall, 2000. Print. Watershed Watch 2013 :: Elizabeth City State University

![REDEEMER’S UNIVERSITY, [RUN] …..a University daring to be positively DIFFERENT Km 46 Lagos Ibadan Expressway, Redempti](https://cdn0.slideserve.com/463624/slide1-dt.jpg)