Download
1 / 26
260 likes | 516 Views
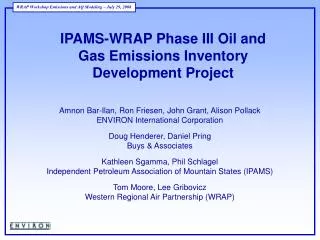
IPAMS-WRAP Phase III Oil and Gas Emissions Inventory Development Project. Amnon Bar-Ilan, Ron Friesen, John Grant, Alison Pollack ENVIRON International Corporation Doug Henderer, Daniel Pring Buys & Associates Kathleen Sgamma, Phil Schlagel

E N D
IPAMS-WRAP Phase III Oil and Gas Emissions Inventory Development Project Amnon Bar-Ilan, Ron Friesen, John Grant, Alison Pollack ENVIRON International Corporation Doug Henderer, Daniel Pring Buys & Associates Kathleen Sgamma, Phil Schlagel Independent Petroleum Association of Mountain States (IPAMS) Tom Moore, Lee Gribovicz Western Regional Air Partnership (WRAP)
Overview • Brief History of oil and gas EI development (Phase I & II) • The Phase III project • Source categories • Temporal and geographic scope • Methodology • Surveys • Source category calculations • Example results for the D-J Basin • Mid-term projections • Far future year projections • Overall project schedule
Oil and Gas Production in the Rocky Mountains • Boom in oil and gas production in this region over the last ten years driven by record prices for crude oil and natural gas • Western states gas production in 1996: • 3.9 trillion cubic feet • Western states gas production in 2006: • 5.9 trillion cubic feet • Activity supported by large fleet of equipment at thousands of individual well sites • Partial inventory of this equipment through state permitting databases • Wide state-to-state variation in permitting thresholds and source categories permitted
History of Oil and Gas EI’s – WRAP Phase I • Represented the first regional inventory for the western U.S. to address oil and gas area sources not previously inventoried • Intent was to create a regionally consistent inventory methodology for oil and gas area source emissions estimates for all of the western states • Output data were model-ready emissions of all criteria pollutants for use in WRAP regional haze modeling for the western U.S. • Focus on regional haze precursor emissions (SOx and NOx) • 2002 current and 2018 future years
History of Oil and Gas EI’s – WRAP Phase II • Focused on improving the methodology from the Phase I work for two specific major NOx source categories: compressors and drill rigs • Utilized direct industry survey to obtain detailed information from the oil and gas companies on this equipment by basin • Applied regionally consistent methodology for entire WRAP domain, and updated baseline year from 2002 to 2005. • Reviewed and updated SO2 emissions from large gas plants
History of Oil and Gas EI’s – WRAP Phase I & II Phase I & II Results – NOx Emissions
History of Oil and Gas EI’s – WRAP Phase I & II Phase I & II Results – SOx Emissions
Why a Phase III? • Phase I & II inventories focused primarily on NOx and SOx – Phase III includes all major criteria pollutants including VOCs • Phase III provides opportunity for greater industry participation to provide most detailed, local equipment and activity data to improve baseline emissions inventories for all basins for all source categories • Phase III updates baseline year to 2006 to reflect increase in oil and gas production from 2002 to 2006, and makes use of best oil and gas production statistics from IHS database • Phase III provides opportunity to improve on estimates, assumptions and approximations from Phase I & II based on comments received on those inventories – can account for well declines, technology advances, new regulations • Phase III analyzes both unpermitted oil and gas sources and state permit data to generate complete oil and gas inventory for all major source categories • Phase III will generate two future year emissions projections: 2012 and 2018
Phase III – Source Categories Phase I and II – Source Categories • Lateral compressor engines • Workover Rigs • Salt-Water Disposal Engines • Artificial Lift Engines (Pumpjacks) • Vapor Recovery Units (VRU’s) • Miscellaneous or Exempt Engines • Flaring • Fugitive Emissions • Well Blowdowns • Truck Loading • Amine Units • Water Tanks • Large Point Sources • (Gas plants, compressor stations) • Drill Rigs • Wellhead Compressor Engines • CBM Pump Engines • Heaters • Pneumatic Devices • Condensate and Oil Tanks • Dehydrators • Completion Venting
Phase III –Scope • Considers most major oil and gas basins in New Mexico, Utah, Colorado, Wyoming, Montana and North and South Dakota • County-level emissions generated for all counties within each basin • Basin boundaries re-defined to align with county boundaries to simplify county-level reporting • Phase III considers all major criteria pollutants from oil and gas activities • NOx • VOC • SOx • CO • PM
Unpermitted sources surveys to O&G producers Permitted sources data from state and/or federal standard permits Combined survey responses for all participating companies Any additional state reporting data IHS database (oil and gas production and well and spud counts) Scaled-up unpermitted sources emissions for entire basin Complete oil and gas emissions inventory for entire basin Phase III Methodology Diagram for Inventory Development
Sample Unpermitted Source Survey – Venting • Participating companies are able to present responses either for a single representative well completion, or for a group of completions, or for all completions conducted in 2006. • Companies are able to provide activity data directly (e.g. vented volume) or an average response will be assigned • Controls (such as green completions or flaring) can be indicated
Sample Unpermitted Source Survey – Compressors • Participating companies are asked to provide information for all compressor engines by type in the county and basin. • Companies are able to provide activity data directly (e.g. annual hours of use and load factors) or an average response will be assigned • Companies are able to provide make/model and emissions factors directly for each compressor engine • Controls (such as three-way catalysts or lean-burn engines) can be indicated
Sample Estimation Methodology – Drilling/Workover Rigs • Typical rig composed of 3-6 engines, each with horsepower ranging from 1300-1500 HP • Average drilling depth, and therefore drilling time, is provided by each survey respondent for all wells drilled in the basin • Engine-specific load factors are used throughout the drilling event • Drilling rig engine emissions factors are either provided by survey respondents for specific rigs or assumed to be Tier 0 and fully deteriorated • The above data and assumptions are combined to estimate all drilling emissions from participating companies • Combined drilling rig emissions from all survey responses scaled to basin-wide emissions by ratio of total spuds in the basin to total spuds by all participating companies
Sample Estimation Methodology – Condensate Tanks Tank size and configuration pressure, temperature, NG composition Condensate Tank EF [lb/barrel-liquid] E&P Tanks 4.0 • Condensate tank emissions estimated if tanks are not permitted in the basin (varies by state permitting threshold) • Typical condensate tank emissions factor derived by defining average tank characteristics from all surveys • Average tank characteristics fed into E&P Tanks 4.0 to obtain flashing and working & breathing emissions factor [lb-VOC/barrel of condensate] • Condensate tank emission factors combined with production data (barrels of condensate) for all participating companies to derive the participating companies’ condensate tank emissions • Combined participating companies’ condensate tank emissions scaled to basin-wide emissions by ratio of total basin condensate production to the participating companies’ condensate production
Sum of total number of devices or venting events from survey responses Sample Estimation Methodology – Vented Sources Total volume of vented gas Vented volume per device or event • Applies to venting source categories such as pneumatic devices, fugitive emissions, and blowdowns/completions • Total volume of vented gas estimated by applying vented volume per device or event to all devices or events obtained from surveys • Average VOC mass fraction of the vented gas is applied to the total vented volume to obtain VOC emissions from vented sources from all participating companies • Combined venting emissions from all survey responses scaled to basin-wide emissions by ratio of total wells in the basin to total wells owned by all participating companies (fugitives/pneumatics), or total gas production in the basin to total gas production owned by all participating companies (well blowdowns)
Example Results – The Denver-Julesburg Basin • Denver-Julesburg (D-J) Basin located in Northeastern Colorado • Includes major O&G developments in Weld and Larimer Counties around metropolitan Denver area • Includes dry gas operations in Yuma County • Baseline 2006 emissions inventory and 2010 mid-term emissions projection generated • Emissions dominated by oil and gas activity in Weld County • Limited dry gas activity in Yuma County also contributing significantly to basin total
D-J 2006 Baseline Results – NOx Emissions By Source Category Basin-wide NOx total: 20,783 (tpy) • NOx emissions dominated by compressor engines (central and wellhead) and drill rigs
D-J 2006 Baseline Results – VOC Emissions By Source Category Basin-wide VOC total: 81,758 (tpy) • Top VOC source categories include condensate tanks, pneumatic devices and fugitives
D-J 2006 Baseline Results – Permitted vs. Unpermitted NOx Emissions • 44% of basin total NOx emissions (20,783 tpy) from unpermitted sources
D-J 2006 Baseline Results – Permitted vs. Unpermitted VOC Emissions • 45% of basin total VOC emissions (81,758 tpy) from previously uninventoried unpermitted sources
Mid-Term Projections Methodology • Mid-term projections are conducted for the scenario year of 2012 (2010 for the D-J Basin) • Basins are examined and geographical groupings are created for purposes of analyzing oil and gas production statistics (e.g. individual counties or groups of counties) • IHS database is used to generate plots of historic oil and gas production, well counts and spud counts from 1970’s to 2006 for each of the basin’s geographic groupings • Historic oil and gas statistics plots are extrapolated to mid-term year using linear, 2nd order polynomial or exponential extrapolation as appropriate • Participating companies review projections to assure the projections are in agreement with anticipated activities and maximum capacities of the basin for each geographic grouping • Extrapolated oil and gas statistics are used to generate scaling factors for each source category, which are then adjusted to account for state and federal regulations, well declines
Mid-Term Projections – D-J Basin Example • Example mid-term projection of well counts in Weld County for 2010
Mid-Term Projections – D-J Basin Example • Comparison of D-J Basin baseline 2006 and mid-term 2010 emissions
Far Future Year (2018) Projections – Methodology • WRAP Phase I & II used Resource Management Plans (RMPs) and Environmental Impact Reports/Statements (EIR/S) to derive estimates of oil and gas activity projections for specific geographical regions • These activity projections were converted into scaling factors for oil and gas production, well counts and spud counts in the regions covered by the RMPs, and EIR/S • In regions not covered by RMPs or EIR/S, used the EIA’s Annual Energy Outlook broad-based regional growth factors for oil and gas production • Scaling factors were applied appropriately by region to all oil and gas source categories • Phase III will likely use a similar methodology but to improve the sources of information by incorporating more recent final RMPs and EIR/S as well as to incorporate public releases of draft RMPs and EIR/S • Phase III will also incorporate well declines and new regulations to adjust far future year emissions projections