Descriptive Study Designs
Explore different descriptive study designs in epidemiology, including ecologic studies, case reports, case series, and cross-sectional surveys. Learn their strengths, limitations, and implications in public health research.

Descriptive Study Designs
E N D
Presentation Transcript
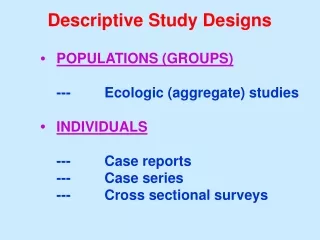
Descriptive Study Designs • POPULATIONS (GROUPS) --- Ecologic (aggregate) studies • INDIVIDUALS --- Case reports --- Case series --- Cross sectional surveys
Ecologic Studies • Measures that represent characteristics of entire populations are used to describe disease and to postulate causal associations. • Measure of interest is correlation between exposure rates and disease rates among different groups. • Correlation coefficient (denoted as r) Range of r is from –1.0 to 1.0 R evaluated in relation to difference from 0.
Ecologic Studies Strengths: • Cheap, quick, and simple (generally make use of secondary data) Limitations: • Cannot link exposure-disease relationship at the individual level • Uses average exposure levels rather than actual levels of exposure • Inability to control for confounding factors
EXAMPLE:Country A:Country B Prevalence-Hypertension 30% 20% Average Salt Consumption Moderate Low Country ACountry B Person Salt Intake Hyp. Salt Intake Hyp. 1 1 Yes 1 Yes 2 1 Yes 1 Yes 3 1 Yes 1 No 4 3 No 1 No 5 3 No 1 No 6 3 No 2 No 7 3 No 2 No 8 5 No 2 No 9 5 No 2 No 10 5 No 2 No Avg. 3.0 30% 1.5 20%
Ecologic Studies The “Ecologic Fallacy”: • Erroneous conclusions based on grouped data • Patterns observed on the aggregate level are not observed on the individual level
Suicide Rate per 100,000 Proportion Protestant In 1951, Durkheim, reported an association between the rate of suicide and proportion of four Prussian provinces of Protestant religion. How might the ecologic fallacy be responsible for this association?
Suicide Rate per 100,000 Proportion Protestant As non-Protestants in each province became more in the minority, these individuals, rather than Protestants, may have been more likely to commit suicide.
Case Reports • Careful and detailed report by one or more clinicians of the profile of a single patient • Document unusual medical occurrences • Can provide clues in identification of a new disease or adverse effects of exposures (i.e. a case report gave the clue OC use increases the risk of venous thromboembolism)
Case Reports Limitations: • No appropriate comparison group • Cannot be used to test for presence of a valid statistical association • Since based on the experience of one person: --- presence of any risk factor may be purely coincidental --- not a true epidemiologic design
Case Series (individual data) • Description of clinical/epidemiologic characteristics of a number of patients with a given disease • Collection of individual case reports occurring within a fairly short period of time
Case Series Strengths: • Used as an early means to identify the beginning or presence of an epidemic • Can suggest the emergence of a new disease (i.e. AIDS)
Case Series Limitations: • Lack of an appropriate comparison group • Cannot be used to test for presence of a valid statistical association • Not a true epidemiologic design
Cross-Sectional Studies • Snapshot of the health status of populations at a certain point in time • For each subject, exposure and disease outcome are assessed simultaneously (hence also called a “prevalence study/survey”) • Compare prevalence of disease in persons with and without the exposure of interest
Cross-Sectional Studies Disease No Disease Exposed a b Not Exposed c d a / (a + b) Prevalence Ratio (PR) = ------------ c / (c + d)
Cross-Sectional Studies Cholesterol CHD No CHD High 100 400 Normal/ Low 50 450 100 / (100 + 400) 0.2 Prevalence Ratio = --------------------- = ---- = 2.0 50 / (50 + 450) 0.1
Cross-Sectional Studies 100 / (100 + 400) 0.2 Prevalence Ratio = --------------------- = ---- = 2.0 50 / (50 + 450) 0.1 Interpretation: In this study population, the prevalence of CHD is 2 times higher among those with high cholesterol, compared to the prevalence in those with normal or low cholesterol.
Cross-Sectional Studies Strengths: • Provides prevalence estimates of exposure and disease for a well-defined population • Easier to perform than studies that require follow-up (hence relatively inexpensive) • Can evaluate multiple risk (and protective) factors and health outcomes at the same point in time
Cross-Sectional Studies Strengths: • May identify groups of persons at high or low risk of disease • Can be used to generate hypotheses about associations between predictive factors and disease outcomes
Cross-Sectional Studies Limitations: • Prevalent rather than incident (new) cases are used – the exposure could be associated with survival after disease occurrence, rather than development of the disease • Temporal sequence between exposure and disease cannot be established * i.e. Which came first, chicken or the egg?
National Surveys • A large set of national epidemiological surveys are conducted by the National Center for Health Statistics (NCHS) --- the Federal Government’s principal vital and health statistics agency. • The NCHS is part of the Center for Disease Control and Prevention (CDC) – under the U.S. Dept. of Health and Human Services.
National Surveys • National Health Interview Survey (NHIS) Principal source of information on the health of the civilian, non-institutionalized household population of the U.S. • National Health and Nutrition Examination Survey (NHANES) Collects information about the health and diet of people in the U.S.
National Surveys • National Health Care Survey (NHCS) Collects a wide range of data on health care use, impact of medical technology, and quality of care provided. • National Immunization Survey (NIS) Collects information on the immunization coverage and health care of children across the U.S.
National Surveys • National Survey of Family Growth (NSFG) Collects data on factors affecting pregnancy and women’s health in the U.S. • National Mortality Followback Survey (NMFS) Aggregate sample of death certificates across the U.S. for targeted research purposes.
National Surveys • National Maternal and Infant Health Survey (NMIHS) Collects data on study factors related to low birthweight, stillbirth, infant illness, and infant death. • Behavioral Risk Factor Surveillance System Collects data on prevalence of personal health behaviors among adults associated with premature morbidity and mortality.
National Surveys/Programs • Youth Risk Behavior Surveillance System Collects data to monitor prevalence of behaviors in youths that results in significant mortality, morbidity, disability, and social problems. • National Program of Cancer Registries (NPCR) • Surveillance, Epidemiology, and End Results (SEER) Program
Other Sources of National Data •National Vital Statistics System --- Birth data --- Mortality data --- Fetal death data --- Marriages and divorces --- Linked births/infant deaths --- National death index • U.S. Census Bureau