Download
1 / 46
460 likes | 482 Views
This project delves into the disparities in life expectancy among different income groups and genders in the United States. By examining data on expected age at death for 40-year-olds, the study highlights significant gaps based on income percentiles, gender, and geographic locations. Factors such as smoking, obesity, and household income play crucial roles in shaping life expectancies. A comparison across cities and income groups underlines the stark differences in life spans, emphasizing the critical role of socioeconomic factors in determining health outcomes.

E N D
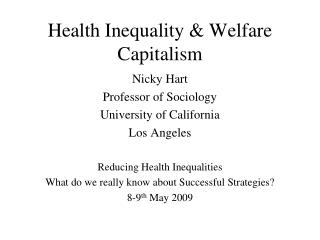
90 Women 85 Men Expected Age at Death for 40 Year Olds in Years 80 75 Women, Bottom 1%: 78.8 Women, Top 1%: 88.9 Men, Bottom 1%: 72.7 Men, Top 1%: 87.3 70 0 20 40 60 80 100 Household Income Percentile Expected Age at Death vs. Household Income Percentile By Gender at Age 40
90 85 Expected Age at Death for 40 Year Olds in Years 80 75 Women, Bottom 1%: 78.8 Women, Top 1%: 88.9 Men, Bottom 1%: 72.7 Men, Top 1%: 87.3 70 0 20 40 60 80 100 Household Income Percentile Expected Age at Death vs. Household Income Percentile By Gender at Age 40 Top 1% Gender Gap 1.6 years Bottom 1% Gender Gap 6.1 years Men Women
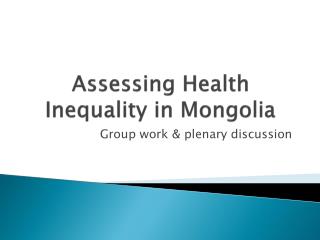
United States - P100 San Marino United States - P50 Canada United Kingdom United States - P25 China Libya Pakistan United States - P1 Sudan Iraq India Zambia Lesotho 60 65 70 75 80 85 90 Expected Age at Death for 40 Year Old Men U.S. Life Expectancies by Percentile in Comparison to Mean Life Expectancies Across Countries
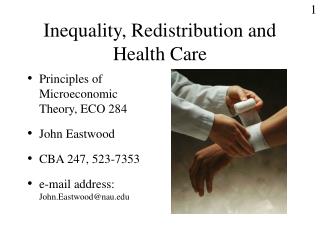
90 Annual Change = 0.20 (0.17, 0.24) Annual Change = 0.18 (0.15, 0.20) 85 Expected Age at Death for 40 Year Olds in Years Annual Change = 0.12 (0.08, 0.16) 80 Annual Change = 0.08 (0.05, 0.11) 75 2000 2005 2010 2015 Year Trends in Expected Age at Death by Income Quartile in the United States For Men Age 40, 2001-2014 1st Quartile 2nd Quartile 3rd Quartile 4th Quartile
90 Annual Change = 0.23 (0.20, 0.25) Annual Change = 0.25 (0.22, 0.28) 88 Annual Change = 0.17 (0.13, 0.20) Expected Age at Death for 40 Year Olds in Years 86 84 Annual Change = 0.10 (0.06, 0.13) 82 2000 2005 2010 2015 Year Trends in Expected Age at Death by Income Quartile in the United States For Women Age 40, 2001-2014 1st Quartile 2nd Quartile 3rd Quartile 4th Quartile
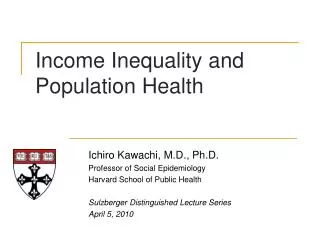
90 85 Expected Age at Death for 40 Year Olds in Years New York City 80 San Francisco Dallas 75 Detroit 70 0 5 10 15 20 $30k $60k $101k $683k Household Income Ventile Race-Adjusted Expected Age at Death vs. Household Income for Men in Selected Major Cities
90 85 New York City San Francisco Expected Age at Death for 40 Year Olds in Years Dallas 80 Detroit 75 70 0 5 10 15 20 $27k $54k $95k $653k Household Income Ventile Race-Adjusted Expected Age at Death vs. Household Income for Women in Selected Major Cities
Race-Adjusted Expected Age at Death for 40 Year Old Men Pooling All Income Groups Note: Lighter Colors Represent Areas with Higher Life Expectancy
Race-Adjusted Expected Age at Death for 40 Year Old Women Pooling All Income Groups Note: Lighter Colors Represent Areas with Higher Life Expectancy
Race-Adjusted Expected Age at Death for 40 Year Olds in Bottom Quartile Top 10 and Bottom 10 CZs Among 100 Largest CZs Note: 95% confidence intervals shown in parentheses
90 85 Expected Age at Death for 40 Year Olds in Years 80 75 70 0 100000 200000 300000 400000 500000 Mean Household Income by Percentile ($) Expected Age at Death vs. Household Income For Men at Age 40
Correlations of Expected Age at Death with Health and Social Factors For Individuals in Bottom Quartile of Income Distribution
Correlations of Expected Age at Death with Other Factors For Individuals in Bottom Quartile of Income Distribution
On average, the life expectancy for a poor 40-year-old in Fayette County is 78.0 years. It is worse than most counties in the U.S. for life expectancy for the poor. There is also a gap between the rich — those in households making more than $100,000 per year — and poor: In Fayette County, the poor will die about 9 years before the rich. That’s roughly equivalent to the difference in life expectancy between an average man in the United States and one in Somalia. It is about 2 years more than the gap for the United States as a whole.
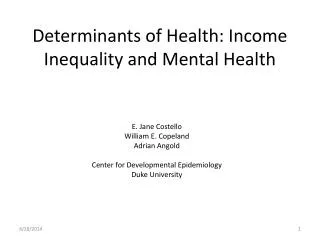
Human social environments encompass: • The immediate physical surroundings and the social relationships and cultural milieus within which defined groups of people function and interact • This can include the built infrastructure; health services; power relations; government; race and class; cultural practices; religious institutions; and beliefs about place and community. • The social environment subsumes many aspects of the physical environment, given that landscapes, water resources, and other features have been at least partially configured by human social processes.
The Health Inequality Project • Obesity and smoking are negatively correlated with age of death • As rates of obesity and smoking go up, life expectancies go down
Smoking bans • No statewide ban in KY, but cities and counties can enact partial and total bans
Rates of smoking have decreased where bans have been enacted – smoking did not just move into the home or onto the streetBirthweights have increased over the period spanning before and after the bans.Businesses have not had negative impacts.
Obesity, poverty, SAD • Government subsidies keep prices for major crops (corn, wheat, soy) in processed food low • Grocery store-bought processed food costs less than fruits and vegetables • Fruits and vegetables are rich in nutrients, but contain relatively few calories. • Higher-calorie, energy-dense processed foods are better short-term bargain • This is why poor in US have higher rates of obesity
Malnutrition: overnutrition • Arises from conditions in which adequate or even abundant food is present, but its quality and type leads to negative health impacts • SAD can lead to obesity, which increases the risk of cardiovascular disease, hypertension, cancer, and type-2 diabetes.
Malnutrition: undernutrition • Lack of adequate food and nutrients • The highest rates of undernutrition are in Africa and the Caribbean, where around 20% of people fail to get enough calories. • 10% of the global population is undernourished, equivalent to around 795 million people • 41 million Americans struggle with hunger
Food insecurity • Inability to access or procure ample quantities of nutritious food. Ranking of food security among developed nations
Food insecurity: food deserts Food deserts are detectable in the Four Corners region of the southwest (Native Americans), rural Mississippi and Alabama, and Appalachia
The Opioid Epidemic • Opiate – derived from opium, as in codeine or morphine • Opioid – drugs that work by binding to the same receptors as opiates, but do not occur naturally • Synthetic opioids – methadone and fentanyl • Semi-synthetic opioids – chemical modification to natural opiates, as in oxycodone and hydrocodone
History of the Opioid Epidemic • Introduction of synthetics and semi-synthetic opiods, notably oxycodone in 1996 • New generation opioids heavily marketed and addiction potential downplayed • Advocated as useful to address chronic pain • Their growing use coincided with long and short-term economic decline • Pain clinics and pill mills proliferated • Once addicted, heroin is easier to obtain than prescription drugs • Heroin is now of exceptionally high quality and inexpensive • Fentanyl is added to heroin and other drugs to increase potency
Correlations of Expected Age at Death with Other Factors For Individuals in Bottom Quartile of Income Distribution Low-income individuals tend to live the longest (and healthful behaviors) in affluent cities with highly educated populations and high levels of government expenditures, such as New York and San Francisco. Rural areas lack this level of investment, have fewer health facilities and doctors, and a history of disempowerment and poverty that tends to exacerbate the conditions that contribute to their health problems
Social contagion Human behavior tends to clusters in both space and time. Health practices, positive or negative, can be reinforced through social networks.
Poverty and environmental health policy • Rockefeller Sanitary Commission • 1964 War on Poverty • Affordable Care Act • Head Start • Title V • SNAP • federal poverty levels (2017) • Medicaid • Medicare • COBRA • Affordable Health Care Act • Personal Responsibility and Work Opportunity Reconciliation Act • Aid to Families With Dependent Children • Temporary Assistance for Needy Families • WIC • HUD Section 8