Download
1 / 47
470 likes | 627 Views
Palmer (after Broadbent). Relevant size. 2. 8. cue 250 ms. interval 750 ms. test 100 ms. (Palmer, after Shaw). Model based on SDT. Processing before decision is assumed to be independent for each stimulus and may or may not be task-specific

E N D
Relevant size 2 8 cue 250 ms interval 750 ms test 100 ms (Palmer, after Shaw)
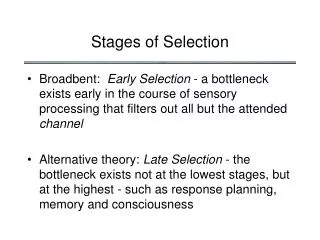
Model based on SDT Processing before decision is assumed to be independent for each stimulus and may or may not be task-specific Set size effect can be calculated using the decision integration model based on SDT (Shaw) 1) The internal representation of each stimulus is independent of set size 2) The stimulus representation is noisy; both target and distracters --> the more distracters in a display, the greater the chance that the brightness of one will fall in the target range
Set size effect can be calculated using the decision integration model based on SDT (Shaw) 3) The decision is determined by the stimulus representation that yields the maximum likelihood (max rule) -- stimulus with the maximum value on any given trial 4) Mean value of distracter’s representation is zero, and its variability is 1 • The effect of increasing set size is to shift the distribution of the maximum stimulus representation generated by the set of distracters (determined by whichever distracter happens to generate the highest value).
SDT assumes that the vertical distracters generate a smaller response from the filters selective to the tilted target • Discriminating target from distractor: • both the mean separation between target and distractors and the intrinsic variablity of these representations determine how discriminable the target is from the distractors • for a given orientation difference between target and distractor, as distributions variance increases, discriminability decreases
Response strength Max rule Easy search: tilt among vertical Hard search: tilt (45) among tilted (22) • p (c) depends on the overlap of both distributions • response to the 45 target is in the same location (~9); response to the tilted distractor is shifted rightward (~4 to ~7)
The maximum rule • Set Size >1 • for finding a single target, a decision based on choosing the largest response across the units is close to the best use of the available information, provided that the responses for each of the units is independent • noise interval (distracters only) • signal interval (n-1 distracters & target) • the observer looks for the largest value of the samples in each presentation and then chooses the presentation interval that has the larger of the two maximum values • the greater the set size, the higher the probability that the maximum emerges from the noise interval
Wolfe, J. M. (1998). What do 1,000,000 trials tell us about visual search? Psychological Science, 9(1), 33-39.
Different tasks yield different slopes But slope is not a simple diagnostic for type
“red” “steep” A limited set of coarse, categorical features are computed
A weighted sum creates an activation map
The activation map: local salience is weighted heavily and will attract attention (bottom-up)
Top-down guidance: Give weight to what you want Find thegreen verticals
The activation map guides re-entrant attentional selection of objects
Object Recognition ? ? ? ? ? ? ? ? Bottleneck Second Stage Guided Search is a two-stage model First Stage
First stage information guides access to the second stage Bottleneck The core idea of Guided Search ? ? ? ? ? ? ? ? First Stage Second Stage
Bottleneck ? ? ? ? ? ? ? ? First Stage Second Stage
Bottleneck binding stage ? ? ? ? ? ? ? ? First Stage Second Stage
A vexing problem Find the 5
Umm…there is no 5 How do you know when to stop?
We know you are not marking every reject How do you know when to stop?
The number marked as rejected is small (~4) How do you know when to stop?
Carrasco, Evert, Chang, & Katz ’95 (fig 1) Orientation X color conjunction - free viewing
Carrasco, Evert, Chang & Katz ’95 (fig 5) Orientation X color conjunction - fixed viewing
Carrasco, Evert, Chang, & Katz ’95 (fig 3) Set size X Eccentricity
Carrasco & Frieder ’97 (fig 3) RT (msec) % ERROR