Download
1 / 30
300 likes | 313 Views
Explore the current state and future outlook of the soybean market in the Midwest region. Discover key statistics, projections, and factors influencing soybean production, consumption, and trade. Stay informed with expert insights and data analysis for informed decision-making.

E N D
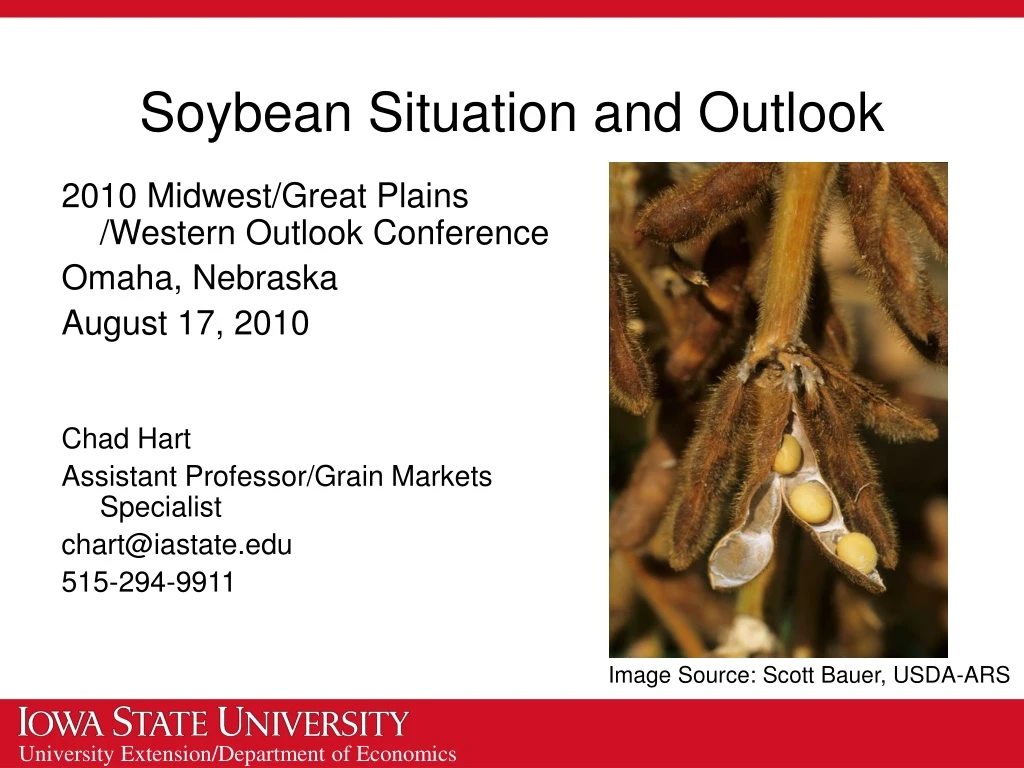
Soybean Situation and Outlook 2010 Midwest/Great Plains /Western Outlook Conference Omaha, Nebraska August 17, 2010 Chad Hart Assistant Professor/Grain Markets Specialist chart@iastate.edu 515-294-9911 Image Source: Scott Bauer, USDA-ARS
U.S. Soybean Supply and Use Source: USDA
U.S. Soybean Yields Source: USDA-NASS
Aug.-Oct. Temperature Outlook Source: NOAA-NWS-CPC
Aug.-Oct. Precipitation Outlook Source: NOAA-NWS-CPC
U.S. Soybean Oil Supply and Use Source: USDA
U.S. Soybean Meal Supply and Use Source: USDA
World Soybean Production Source: USDA
Soybeans – Argentina & Brazil Source: USDA
Population Source: U.S. Bureau of the Census, International Data Base
World Consumption Growth In 2020, we will use 26 billion bushels of wheat, 36 billion bushels of corn, and 11 billion bushels of soybeans. In 2000, we used 21.5 billion bushels of wheat, 24 billion bushels of corn, and 6 billion bushels of soybeans. Sources: USDA, FAPRI
Exchange Rates (Jan. 2009 = 1) Source: USDA-ERS
Soybean Export Sales Source: USDA-FAS
2009 U.S. Soybean Exports Source: USDA-FAS
Advance Sales Source: USDA-FAS
Advance Sales Source: USDA-FAS
Biodiesel Margins Source: ISU-CARD
Input Costs Source: USDA, Agricultural Prices, July 30, 2010
Thank you for your time!Any questions?My web site:http://www.econ.iastate.edu/faculty/hart/Iowa Farm Outlook:http://www.econ.iastate.edu/outreach/agriculture/periodicals/ifo/Ag Decision Maker:http://www.extension.iastate.edu/agdm/