Download
1 / 32
320 likes | 400 Views
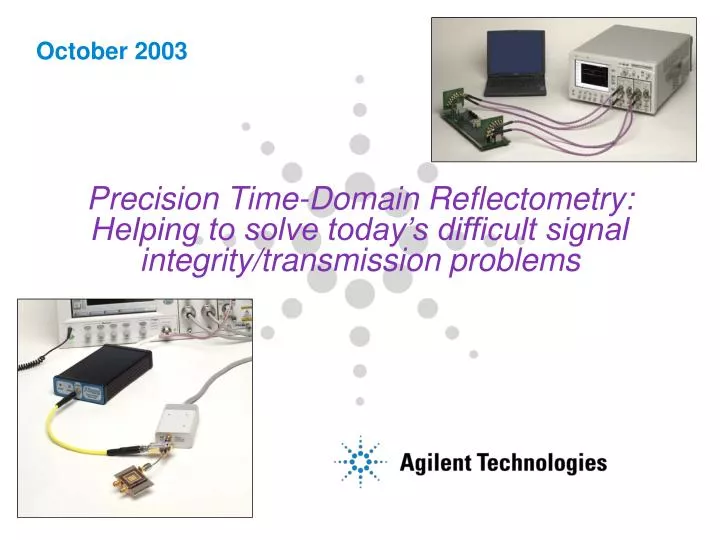
October 2003. Precision Time-Domain Reflectometry: Helping to solve today’s difficult signal integrity/transmission problems. Agenda. 1. Brief TDR review Some new things and some old things seen in a new way 2. Advanced calibration techniques unique to Agilent

E N D
October 2003 Precision Time-Domain Reflectometry: Helping to solve today’s difficult signal integrity/transmission problems
Agenda 1. Brief TDR review Some new things and some old things seen in a new way 2. Advanced calibration techniques unique to Agilent 3. New techniques for improved 2-event resolution and impedance accuracy 4. S-parameter results from the TDR Where to find out more: New Application Note (see last slide) TDR Customer Presentation, Oct ‘03
Transmitted energy Incident energy Reflected energy 1. What is TDR? • Time domain reflectometry • Analyze the quality of high-speed components and channels for transmission quality • Are there any reflections due to impedance discontinuities? • How big are they? • Where are they? TDR Customer Presentation, Oct ‘03
Ei Transmitted energy Incident energy Reflected energy TDR: Launch a fast step into the DUT and measure anything that reflects back OSCILLOSCOPE Er ZL TRANSMISSION SYSTEM UNDER TEST STEP GENERATOR Typical Step: 200 mV, 250 kHz‘square wave’ with 35 ps rise time TDR Customer Presentation, Oct ‘03
What is TDR? • Launch a fast pulse into the device under test • Measure what reflects back from the DUT • The size and polarity of any reflections indicates the magnitude of any discontinuity • The time it takes for the reflection to return is used to indicate the location of any discontinuity Transmission lines with changing impedance Input pulse Reflected pulse(s) TDR Customer Presentation, Oct ‘03
Displaying impedance in the Time Domain:TDR provides “Instantaneous Impedance” Typical TDR result • A: 50 Ohm cable • B: Launch to microstrip • C: 50 Ohm microstrip • D: 75 Ohm microstrip • E: 50 Ohm microstrip • F: “open” circuit F D B A E C Compare to a network analyzer which provides impedance as a function of frequency TDR Customer Presentation, Oct ‘03
2. Some important advantages of the 86100 TDR • Would you buy a network analyzer without a calibration kit? No! • Without calibration we are forced to rely completely on the raw performance of the instrument and have no ability to remove error causing mechanisms outside the instrument that are in the measurement path DUT TDR Customer Presentation, Oct ‘03
Systematic TDR measurement errors can be removed through simple calibration • A simple concept:By placing known reflections on the system, the measurement errors can be identified and removed • Simple to perform: Connect a short and a load at the reference plane • Errors caused by cabling, attenuation etc. can be removed from the measurement • Agilent is the only provider to use Normalization. Test Fixture Device Under Test Blue Trace - Normalized Green Trace - Standard Error = 2.3 ohms TDR Customer Presentation, Oct ‘03
What arguments might you hear against this? • “We don’t need fancy calibrations. We have a precision airline inside the TDR” • But what can you do for error mechanisms beyond the TDR output? • Agilent doesn’t need to do a calibration either, unless there is something beyond the TDR output that degrades the results (which, in real life, there almost always is) • “Calibration is a weak excuse for bad hardware” • Calibration techniques are a proven route to a better measurement • Can you imagine doing network analysis without a good calibration process? This is all explained in more detail in the new Application Note (see last slide) TDR Customer Presentation, Oct ‘03
3. Some problems the industry faces….. • Data speeds are getting faster in electrical circuits • Devices are getting smaller and more complex • As edge speeds increase, more high-frequency energy is present • More difficult to control impedance TDR Customer Presentation, Oct ‘03
The two-event resolution(how close can two reflections be and still be seen as separate events) Closely spaced reflections can get blurred together Two-event resolution set by material velocity and TDR system risetime How accurate is the measurement of the reflection magnitude As step speeds increase, more high frequency content Reflections often get worse Reflections for a 20 ps edge can be much larger than a 35 ps edge The edgespeed of the TDR step sets two important measurement levels TDR Customer Presentation, Oct ‘03
A 35 picosecond step is insufficient to see closely spaced reflections • With a 35 ps step, all you know is the device is there • If there is more than one reflection, we can’t tell 35ps TDR Customer Presentation, Oct ‘03
High resolution allows your customers to see what they could never see before • At 9 ps step speed, we see 5 separate reflections • Each event is easily seen and quantified hermetic feedthrough coaxial-microstrip launch coaxial feed- through 9ps V-connector pin-collette V-connector pin-collette microstrip transmission line TDR Customer Presentation, Oct ‘03
A faster step often yields a higher reflection magnitude • At 35 ps, the reflections look very small (~52 Ohms) • At 9 ps the reflections increase to over 58 Ohms • The 35 ps result isn’t necessarily wrong and the 9 ps right • Test at an edge speed similar to how the device will be used • Some examples • 20 to 35 ps for 10 Gb/s • 5 to 12 ps for 40 Gb/s Designers working at the very high data rates or with very small devices need a very fast TDR TDR Customer Presentation, Oct ‘03
Digitally increase the edge speed through some signal processing “Normalization calibration” (discussed earlier) can use DSP to enhance the effective edge speed Can decrease the risetime to less than 20 ps Electrically speed up the pulse Use external hardware to produce a much faster edge How can I test faster than the 35 ps the TDR is specified at? Two choices TDR Customer Presentation, Oct ‘03
35ps 86100/Picosecond Pulse Labs 4020 Measurement capabilities The Picosecond Pulse Labs 4020 modules takes the 35 Picosecond pulse from the Agilent TDR and increases the speed to under 9 picoseconds Two-event resolution is improved by a factor of 4! (1.5 mm ‘air’, less than 1 mm in common dielectrics) <9ps TDR Customer Presentation, Oct ‘03
Optimizing Measurements 54754A TDR module 86118A • You will lose your edge speed if you have: • Excess or poor quality cabling to and from the DUT • The scope receiver channel has insufficient BW • Recommend TDR with the 86118A ~75 GHz remote plug-in: • Max. bandwidth • Minimum cabling distances Sampling Port 4020 Remote TDR Head Device Under Test TDR Customer Presentation, Oct ‘03
Configuring a system • 86100 A or B mainframe (3.05 FW or above) • 54754A TDR plug-in • 86118A 70 GHz plug-in • Lower BW channels can be used, but edgespeed and resolution will be reduced • Cabling between the DUT and the receive channel degrades TDR speed • Picosecond 4020 TDR or TDT enhancement module TDR Customer Presentation, Oct ‘03
Using the 4020 with TDR’s that don’t use Normalization TDR without Normalization 4020 pulse • PSPL 4020 works with other TDRs: • Significant pulse aberrations. Cannot be calibrated out • If pulse aberrations are not removed, they can be misinterpreted as close-in reflections • 86100 TDR calibration significantly improves the 4020 pulse quality • Normalization also provides an excellent way to eliminate fixturing errors 86100 4020 pulse TDR Customer Presentation, Oct ‘03
DUT Incident wave Transmitted wave TDT t Reflected wave TDR DUT Incident wave Transmitted wave S21 t Reflected wave S11 4. Frequency domain analysis is critical for completely understanding device performance TDR Customer Presentation, Oct ‘03
Benefits of S-parameter analysis “There is no fundamental difference in the information content between the time domain and the frequency domain”Eric Bogatin Chief Technical Officer GigaTest Labs • Some things are just easier to see in the frequency domain • Resonances • Frequency response • Device modeling can be more accurate with frequency domain data • Some critical measurements of differential devices are better understood as a function of frequency TDR Customer Presentation, Oct ‘03
DUT Changing the way high speed digital customers view VNA’s “Everything you ever wanted to know about your device… and more” VNA covers all combinations of in, out, reflections, & crosstalk. All combinations contained in a 16 element matrix for a 4 port DUT. TDR Customer Presentation, Oct ‘03
For differential circuits, frequency domain analysis helps even more Balanced (Differential) devices can be analyzed as pairs (Mixed-Mode S-parameters) rather than single ended • Differential are circuits becoming more important at high speeds • Differential behavior can be much different than viewing each port individually (there is transmission line coupling designed in ) • Differential circuits reduce emissions and are less susceptible to radiation • Like making the cross-talk work for you. Port 2 Port 1 Differential Common • Less far field emissions (crosstalk) • More cancellation of incoming interference TDR Customer Presentation, Oct ‘03
What About Non-Ideal Devices? Undesirable mode conversions cause emission or susceptibility problems • Differential-stimulustocommon-response conversion + = EMI Generation Imperfectly matched lines mean the electromagnetic fields of the signals are not as well confined as they should be – giving rise to generation of interference to neighboring circuits. • Common-stimulustodifferential-response conversion + = EMI Susceptibility Imperfectly matched lines mean that interfering signals do not cancel out completely when subtraction occurs at the receiver. Measured by stimulating common-mode to simulate interference. TDR Customer Presentation, Oct ‘03
Example SCD21: Drive port 1 differentially and measure what has been converted to common mode at port 2 S-Parameters describe differential well.Four quadrants of differential/common mode S parameters: S(response,stimulus,output,input) TDR Customer Presentation, Oct ‘03
Everything you ever wanted to know….. Frequency domain s-parameters can be used to gain insight in frequency domain plots and time domain views. Mixed Mode S Parameters Displayed in the Time Domain Single ended S Parameters Mixed Mode S Parameters TDR Customer Presentation, Oct ‘03
VNA, TDR, or both? • All of the S-parameter data available using the Physical Layer Test System (PLTS) is now available using the 86100 TDR! • N1930A • Controls 86100 TDR • Guided setup and calibration • Automatic deskew • Conversion of TDR data to complete S parameter results TDR Customer Presentation, Oct ‘03
“True” differential measurements • Some TDRs make a big deal of producing both a negative and a positive step for doing differential TDR. “True” differential • Agilent produces only positive pulses and then uses math to build a differential measurement A differential system has coupled lines. The electromagnetic fields will be very different for two positive pulses. How can you get the right impedance result if you don’t have the correct voltages present? Agilent’s method provides differential, common mode, cross terms, all with a single, accurate setup. And this method simplifies the design to allow almost perfect matching of the two positive pulses giving the most accurate results.. TDR Customer Presentation, Oct ‘03
There are very good reasons why we do what we do…. • We use superposition techniques to combine the results of multiple separate measurements • “I learned superposition in my first course in electronics. I believe it for circuits with wires and resistors…but I’m not sure about electromagnetics” From the classic text on electromagnetics, “Fields and Waves in Communications Electronics” by Ramo, Whinnery, and Van Duzer, (1965, John Wiley and Sons) we read “It is frequently possible to divide a given field problem into two or more simpler problems, the solution of which can be combined to obtain the desired answer. The validity of this procedure is based on the linearity of the Laplace and Poisson equations. That is 2(1 + 2 ) = 21 + 22 and 2(k1 ) = k21 The utility of the superposition concept depends on finding the simpler problems with boundary conditions which add to give the original boundary conditions”. Or….. TDR Customer Presentation, Oct ‘03
Don’t worry….it’s covered in the new Application Note! Linear, passive device to be tested • Easy to read and digest • TDR is valid only for linear passive devices (or active devices configured as linear and passive). So our technique is completely valid • We could have built it with a + and – pulse. Important reasons we did what we did • Allows almost perfect symmetry in the stimulus on each leg • Asymmetry leads to mode conversion and potentially critical measurement errors 86100 channel steps overlaid – almost exactly the same TDR Customer Presentation, Oct ‘03
By the way…..the VNA analysis is also based on superposition • The VNA can only stimulate one port at a time • The VNA uses sinewaves (doesn’t even use pulses!) • Precision results obtained by combining results after taking several individual measurements • No one ever questions the accuracy of a VNA. “True differential is best” is a myth, and one that is keeping you from making the most accurate measurements. TDR Customer Presentation, Oct ‘03
Summary • Review of TDR • Why Calibration gives superior results • Speeding the pulse up significantly for higher resolution • Using frequency domain analysis from TDR data to get more insight • Why ‘true differential is better’ is a myth that may be keeping you from making the best measurements • New literature • Application Note: High-precision Time Domain Reflectometry: 5988-9826EN • Flyer: 86100 and the Picosecond 4020 lit # 5988-9825EN • Accessories Flyer: lit # 5980-2933EN TDR Customer Presentation, Oct ‘03