Download
1 / 23
280 likes | 613 Views
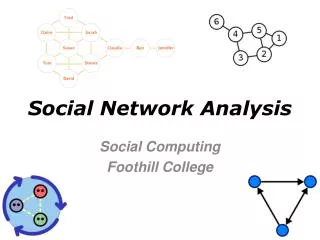
Social Network Analysis in R. Enabled Analytics: The vision. What is Social Network Analysis?. A way of mapping and measuring relationships Can be applied to many types of networks Provides visual inspection, as well as mathematical analysis

E N D
Enabled Analytics:The vision • What is Social Network Analysis? • A way of mapping and measuring relationships • Can be applied to many types of networks • Provides visual inspection, as well as mathematical analysis • A way to understand complex problems within a network of people or objects
Enabled Analytics:The vision • Objectives • To identify important entities/people within a given network • To find people within a network that can influence other people’s behavior
Enabled Analytics:The vision • Social Networks are Everywhere
Enabled Analytics:The vision • Social Networks are Everywhere
Enabled Analytics:The vision • The Mathematics: Graph Theory
Enabled Analytics:The vision • Software • has many network analysis packages: igraph, SNA, S.N.O.R.T., tnet
Enabled Analytics:The vision • Pitfalls • Not a one person job • The necessary computers are very expensive • The most basic measurements are computationally expensive • Sampling is virtually impossible • Data is not easy to obtain • Data can be very large
Enabled Analytics:The vision • Ever Expanding Data
Enabled Analytics:The vision • Ever Expanding Data
Enabled Analytics:The vision • Metrics • Social Network Analysis metrics measure the importance of a particular node • Measures of “center” Mohamed Atta Zacarias Moussaoui Marwan Al-Shehhi Essid Sami Ben Khemais
Enabled Analytics:The vision • Betweeness Centrality
Enabled Analytics:The vision • Betweeness Centrality NawafAlhamzi Mohamed Atta Zacarias Moussaoui Hani Hanjour Essid Sami Ben Khemais
Enabled Analytics:The vision • Closeness Centrality
Enabled Analytics:The vision • Closeness Centrality • Special case: Graphs that are not connected
Enabled Analytics:The vision • Closeness Centrality Mohamed Atta NawafAlhamzi Hani Hanjour Ramzi Bin al-Shibh Marwan Al-Shehhi
Enabled Analytics:The vision • Custom Metrics
Enabled Analytics:The vision • First Order Influence Centrality first.order.influence<-function(g,vids,weight=NULL,nodeweight=NULL){ result<-vector('numeric',length(vids)) if(is.null(nodeweight)==F){ nweight<-sum(nodeweight) }else{ nweight<-vcount(g) } for(z in1:length(vids)){ arcs<-incident(g,vids[z],'out') if(length(arcs)==0){ next } if(is.null(weight)==F){ if(is.numeric(weight)==F){ arcweights<-sum(get.edge.attribute(g,weight,arcs)) }else{ arcweights<-sum(weight[arcs]) } }else{ arcweights<-length(arcs) } result[z]<-arcweights/nweight } result }
Enabled Analytics:The vision • Second Order Influence Centrality second.order.influence<-function(g,vids,weight=NULL,nodeweight=NULL){ result<-vector('numeric',length(vids)) if(is.null(nodeweight)==FALSE){ nweight<-sum(nodeweight,na.rm=TRUE) }else{ nweight<-vcount(g) } inner<-function(g1,vids2,weight1=weight,n2weight=nweight){ inr<-vector('numeric',length(vids2)) for(z in1:length(vids2)){ arcs<-incident(g1,vids2[z],'out') if(length(arcs)==0){ next } if(is.null(weight1)==F){ if(is.numeric(weight1)==F){ arcweights<-sum(get.edge.attribute(g1,weight1,arcs)) }else{ arcweights<-sum(weight1[arcs]) } }else{ arcweights<-length(arcs) } inr[z]<-arcweights/n2weight } inr } for(iin1:length(vids)){ hood<-neighbors(g,vids[i],'out') if(length(hood)==0){ next } result[i]<-sum(inner(g1=g,vids2=hood,weight1=weight,n2weight=nweight)) } result }
Enabled Analytics:The vision • KPMG [Link] versus KSU
Enabled Analytics:The vision • KPMG [Link] versus KSU
Enabled Analytics:The vision • References • Ranking of Closeness Centrality for Large-Scale Social Networks, Kazuya Okamoto, Wei Chen, Xiang-Yang Li • Krebs, Valdis. "Uncloaking Terrorist Networks" First Monday [Online], Volume 7 Number 4 (1 April 2002) • Opsahl, T., Agneessens, F., Skvoretz, J., 2010. Node centrality in weighted networks: Generalizing degree and shortest paths. Social Networks 32 (3), 245-251
Enabled Analytics:The vision • Resources • The igraph library http://igraph.sourceforge.net/ • www.orgnet.com • S.N.A.P. http://snap.stanford.edu/snap/index.html