Download

1 / 21
210 likes | 327 Views
Quantitative Tolerance Criteria for SIMon: Cell Death and Dysfunction. Barclay Morrison III Columbia University. ‘Virtual’ Crash-Test Evaluation. Requires development in three fields: Computational models of vehicles Computational models of humans Compatible human tolerance criteria.

E N D
Quantitative Tolerance Criteria for SIMon:Cell Death and Dysfunction Barclay Morrison III Columbia University
‘Virtual’ Crash-Test Evaluation • Requires development in three fields: • Computational models of vehicles • Computational models of humans • Compatible human tolerance criteria • Data will support SIMon’s cumulative strain damage measure (CSDM) • Compatible with other FE models WSUBIM-2000 Zhang, J.Biomech.Eng. (2004), 226
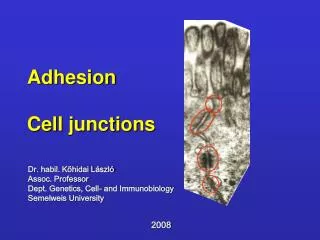
Tissue Level Tolerance Criteria • Directly determine tolerance criteria to deformation • In vitro model • Easy access to the tissue • Precise control and verification of biomechanics • Cell damage and death • Propidium iodide staining • Hippocampus • Cortex • Neuronal function • Electrophysiology
Nissl CA1 DG CA3 In Vitro Injury Model • 2 Components • Tissue culture model • Organotypic brain slice cultures • Maintain anatomical structures • Possible to quantify cortical, CA1, CA3, and DG cell death • Injury device • Precise control over biomechanics • Strain and strain rate • Sterile injury of the cultures • Measure cell death over time Morrison III, B., Cater, H. L., Benham, C. D., and Sundstrom, L. E., J.Neurosci.Methods 150: 192-201, 200
In Vitro Model of TBI • Precise control of • Injury biomechanics • Extracellular environment • Increased access to tissue • Repeated measures • Challenge • Appropriate loading for TBI • E >10% ; E’ >10 s-1
Tolerance Experimental Design • Different combinations of strain and strain rate • Measure region specific cell death/damage over time • Determine tolerance criteria • Region specific tolerance • Repeated measures ANOVA • Time X Region X Strain X Rate • Predictive function Strain Rate (s-1) Strain • = Hippocampus New Additions = CortexNew Additions
Hippocampus Cell Death Response • Raw data from > 1000 cultures • CA1, CA3, DG Region dependent • Time post-injury Damage develops over time • Strain Correlated with strain • Strain rate Not correlated with strain rate! CA1 CA3
3 Days Post 4 Days Post Predictive Function for Cell Death • FE tolerance criteria cell death prediction CA1 & CA3 DG Cater, H. L., Sundstrom, L. E., and Morrison III, B., J.Biomechanics 39: 2810-2818, 2006
Day 2 Day 1 Day 4 Day 3 Strain Rate Strain Rate Strain Rate Strain Rate Strain Strain Strain Strain Cortex Cell Death Response
Time Strain Strain Rate All significant factors Cortex Cell Death Response
Day 4 Day 3 Strain Rate Strain Rate Strain Strain Cortex Cell Death Response • FE tolerance criterion cell death prediction • Criterion includes rate • Cortex may be less vulnerable than hippocampus
CA1 & CA3 DG Regional Susceptibility Conclusion • Hippocampal tolerance criteria completed • CA1 and CA3 have the same tolerance criterion • Time and strain dependent • Cortical tolerance criterion in progress • Time, strain, and perhaps strain rate dependent • Quantifying more groups to clarify relationship • 1/s and 50/s groups • 10% and possibly 50% groups Cortex
Anatomical Material Properties • Brain is non-homogeneous • Motivation • FE models becoming more detailed • Capturing anatomical structures • Correlate anatomical damage prediction with histology • Require material properties • Same spatial resolution as the anatomy • Rat – most widely used animal model for TBI • Least data on mechanical properties due to small size
Atomic Force Microscope • Material property determination • From micro-indentation • Calculate tissue reaction force from • Cantilever deflection and stiffness • Calculate modulus from • Tip geometry • Indentation depth
Anatomical Material Properties • Hippocampal slices • Acute • Still alive – in culture medium • Realistic cellular environment • No post-mortem delay • 37°C, physiological pH, physiological osmolality
* CA3 CA1 Modulus along the Cell Body Layer • Probed by location in acute hippocampal slices • 3 x 3 indentation arrays, 6 μm spacing
CA1P= CA1 pyramidal cell layer CA1SR= CA1 stratum radiatum DG= dentate gyrus CA3SR= CA3 stratum radiatum CA3P= CA3 pyramidal cell layer Study 2: Indentation Locations • 6 x 6 indentation arrays, 6 μm spacing
CA1P= CA1 pyramidal cell layer CA1SR = CA1 stratum radiatum DG = dentate gyrus CA3SR = CA3 stratum radiatum CA3P= CA3 pyramidal cell layer Regional Differences • REGION significantly affected modulus 3 µm indentation depth Elkin, B. S., Azeloglu, E. U., Costa, K. D., and Morrison III, B., J.Neurotrauma (submitted)
Ben Elkin Zhe Yu Evren Azeloglu Kevin Costa SCIB Whitaker Foundation NIH NINDS Acknowledgements Columbia University Southampton University • Lars E. Sundstrom • Heather L. Cater • GlaxoSmithKline • Medical Research Council • Defense Science and Technology Laboratory • European Commission
Population spike 2000 1500 1000 Amplitude (mV) 500 * 0 0 50 100 150 200 Stimulus intensity (mA) 2000 1500 1000 Amplitude (mV) * * * * * * * * * * * 500 * * 0 0 50 100 150 200 Stimulus intensity (mA) Functional Damage • Acute and delayed responses 0 hours post 4 days post Cater, H. L., Gitterman, D., Davis, S. M., Benham, C. D., Morrison III, B., and Sundstrom, L. E., J.Neurochem. (in press) Southern Consortium for Injury Biomechanics