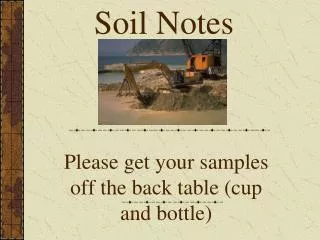
Precision Soil Testing Trends and Variability in Canada
340 likes | 360 Views
This study examines the trends and variability in precision soil testing for different crops in Canada from 1986 to 2017. The results show the median soil nitrate levels and the percentage of soil samples with different nutrient levels. The study also highlights the variability between fields for each crop. The data is based on zone or grid samples tested compared to conventional whole-field composite samples.

Precision Soil Testing Trends and Variability in Canada
E N D
Presentation Transcript
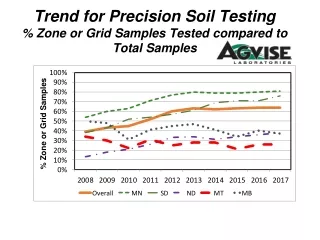
Trend for Precision Soil Testing% Zone or Grid Samples Tested compared to Total Samples
%Zone or Grid Samples Tested Compared to Conventional Whole Field Composite Samples in 2017
AGVISE Laboratories%Zone or Grid Samples – Northwood laboratory1997 - 2017 % Grid or Zone Samples Tested Compared To Conventional Whole Field Composite Samples Tested
Median Soil Nitrate following Wheat in 2017 MB Fall 2017 Samples 24 (lb/a 0-24” samples) 28 35 45 34 25 29 47 40 59 32 25 ND 43 84 35 26 80 63 40 MN 62 29 SD 61 50
Average Soil Nitrate Following “Wheat” in Canada1986 - 2017 Nitrate-N (0-24” lb/a)
Soil Nitrate Variability Between Fields Following “Wheat” in Canada 2016 & 2017
Median Soil Nitrate following Canola in 2017 MB Fall 2017 Samples 28 (lb/a 0-24” samples) 42 40 31 32 38 42 34 31 40 36 26 ND 59 42 MN SD
Average Soil Nitrate Following “Canola”1986 - 2017 Nitrate-N (0-24” lb/a)
Soil Nitrate Variability Between Fields Following “Canola” in Canada – 2016 & 2017
Average Soil Nitrate Following “Barley” in Canada1986 - 2017 Nitrate-N (0-24” lb/a)
Soil Nitrate Variability Between Fields Following “Barley” in Canada – 2016 & 2017
Average Soil Nitrate Following “Potato” in Canada1986 - 2017 Nitrate-N (0-24” lb/a)
Soil Nitrate Variability Between Fields Following “Potato” in Canada – 2016 & 2017
Median Soil Nitrate following Corn in 2017 Fall 2017 samples MB (lb/a 0-24” samples) 56 61 59 44 52 37 47 ND 56 43 43 47 54 32 66 53 MN 35 SD 57 65 45 59
Average Soil Nitrate Following “Corn” in Canada1988 - 2017 Nitrate-N (0-24” lb/a)
Soil Nitrate Variability Between Fields Following “Corn” in Canada – 2016 & 2017
Average Soil Nitrate following Soybean in 2017 Fall 2017 samples MB 23 (lb/a 0-24” samples) 29 24 36 28 23 30 21 23 29 15 22 ND 22 23 23 22 20 26 MN 22 19 SD 28 30 22
Average Soil Nitrate Following “Soybeans” in Canada 1998 - 2017 Nitrate-N (0-24” lb/a)
Soil Nitrate Variability Between Fields Following “Soybean” in Canada 2016 & 2017
% Soil Samples with Phosphorus less than 10 ppm Fall 2017 samples MB 42% (0-6” samples) 39% (Olsen P test) 49% 48% 27% 65% 29% 21% 29% 66% 65% 64% 52% 57% 67% ND 47% 45% 61% 48% 56% 36% 58% MN 36% 50% 38% SD 31% 39% 33% 34%
% Soil Samples with Potassium less than 150 ppm MB Fall 2017 samples 30% 21% (0-6” samples) 33% 28% 21% 10% 16% 29% 14% 4% 7% 3% 19% 79% 39% ND 9% 23% 60% 11% 46% 7% 43% 5% 6% 26% MN 28% SD 29% 1% 5% 25% 35%
% Soil Samples with Zinc less than 1.0 ppm MB Fall 2017 samples 51% 62% (0-6” samples) 59% 66% 35% 87% 48% 27% 43% 69% 89% 81% 41% 68% 47% ND 51% 70% 17% 83% 53 52% 17% 77% 43% MN 52% 24% SD 13% 57% 41% 30% 21%
% Soil Samples with Sulfur less than 15 lb/a MB Fall 2017 samples 2% 5% (0-6” samples) 5% 2% 2% 5% 9% 4% 3% 36% 7% 11% 6% 19% 7% ND 14% 77% 20% 27% 13% 29% 80% 55% MN 48% 32% 73% SD 79% 89% 49% 40% 59%
% Soil Samples with %OM less than 3.0% MB Fall 2017 Samples 7% 6% (0-6” samples) 21% 3% 20% 29% 30% 9% 17% 74% 30% 40% 25% 26% 43% ND 29% 58% 76% 25% 26% 30% 25% 50% MN 26% 13% 11% SD 20% 28% 4% 24% 6%
% Soil Samples with Chloride less than 40 lb/a MB Fall 2017 Samples 52% (0-24” samples) 34% 26% 47% 10% 38% 37% 21% 23% 81% 46% 60% 33% 21% ND 53% 78% 40% 54% 79% 90% 83% 41% MN 67% 70% SD 54% 78% 75%
% Soil Samples with Copper less than 0.5 ppm MB Fall 2017 samples 11% 4% (0-6” samples) 28% 8% 29% 17% 15% 4% 19% 3% 16% 5% 14% 37% 49% ND 11% 52% 12% 33% 15% 12% 36% 24% 12% MN 12% 10% SD 3% 1% 6% 3%
% Soil Samples with Boron less than 0.4 ppm MB Fall 2017 samples 1% (0-6” samples) 0% 5% 0% 3% 1% 7% 1% 2% 3% 3% 9% 3% 23% 9% ND 3% 88% 13% 25% 3% 11% 51% 16% 16% 17% MN 21% SD 9% 19% 9% 43% 18%
% Soil Samples with Soil pH greater than 7.3 MB Fall 2017 samples 72% 97% (0-6” samples) 79% 85% 89% 77% 53% 90% 74% 72% 82% 55% 82% 59% 98% ND 51% 10% 71% 46% 83% 31% 49% 21% 30% MN 43% 58% SD 17% 30% 21% 30% 23%
% Soil Samples with Soil pH less than 6.0 MB Fall 2017 samples 1% 0% (0-6” samples) 3% 1% 4% 1% 18% 7% 1% 1% 1% 5% 2% 9% 1% ND 4% 29% 2% 12% 3% 13% 16% 15% 11% MN 11% 8% 15% SD 14% 40% 32% 13% 8%
% Subsoil Samples with pH less than 7.0 MB Fall 2017 samples 1% 1% (0-6” samples) 2% 1% 5% 2% 13% 1% 1% 2% 1% 1% 2% 5% 1% ND 2% 2% 3% 1% 7% 7% 9% 4% MN 13% 3% 3% SD 19% 7% 4% 19%
% Soil Samples with Carbonate greater than 5.0% MB Fall 2017 samples 43% (0-6” samples) 59% 32% 21% 35% 10% 15% 36% 14% 16% 13% 4% 31% 34% 5% ND 6% 10% 10% 40% 6% 10% 0% 3% MN 14% 26% SD 17% 8% 2% 1%
% Soil Samples with Salts greater than 1.0 MB Fall 2017 Samples 15% 24% (0-6” samples) 17% 21% 37% 17% 13% 19% 23% 5% 26% 11% 43% 20% 7% ND 12% 5% 4% 19% 11% 3% 4% 16% MN 6% 3% SD 1% 1% 3% 8% 5%
Manitoba - % Samples Testing with Salts greater than 1.0 582 Grand Forks R0G - Winkler R0K - Brandon 1:1 salt method – expressed as mmhos/cm