Proton Spin
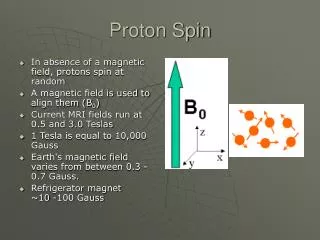
Proton Spin. In absence of a magnetic field, protons spin at random A magnetic field is used to align them (B 0 ) Current MRI fields run at 0.5 and 3.0 Teslas 1 Tesla is equal to 10,000 Gauss Earth's magnetic field varies from between 0.3 - 0.7 Gauss.

Proton Spin
E N D
Presentation Transcript
Proton Spin • In absence of a magnetic field, protons spin at random • A magnetic field is used to align them (B0) • Current MRI fields run at 0.5 and 3.0 Teslas • 1 Tesla is equal to 10,000 Gauss • Earth's magnetic field varies from between 0.3 - 0.7 Gauss. • Refrigerator magnet ~10 -100 Gauss
MR visible nuclei • Protons must be unbound to allow them to spin and change spins • Bound protons are not MR visible as they don’t emit RF from energy changes • Cortical bone contains bound H and thus always appears black on MR • Fat and Water contain lots of unbound H and make soft tissue imaging so sensitive to MR
Precession • In a magnetic field the proton precesses at a given frequency based on the Larmor equation • This frequency is based on field strength and the specific nucleus – each has a different frequency • In MRI the precession frequencies occur in the RF range and are detected by an antenna
Pulse sequence • Tipping the spin into a different plane from B0 • B1 is the field used to tip the spin measured in degrees from B0 • 90° RF pulse tips it into the transverse plane or x’ • 180° RF pulse inverts it to a –z direction
Pulse Sequence • Tipping the spin into another plane puts them into a high energy state once the new field is removed • Decay happens rapidly back to the original state and the energy given off by the decay is in the radiofrequency range • This energy is called the FID (Free Induction Decay) • This is received by an antenna
Signal to Noise Ratio • Signal to Noise Ratio • The amount of useful signal compared to useless noise from RF • Coherent signal is additive while incoherent noise tends to cancel out • SNR is proportional to the square root of the number of averages. • Doubling the # of slices doubles time but improves SNR by 1.4
T2 • Having been tipped into the transverse plane, the net magnetisation begins to dephase (T2*) • Rapid decay of unified spin based on tissue and magnetic field
T1 • Once fully dephased the spins return to equilibrium (T1) • Takes longer than T2 to reach equilibrium
TE and TR • TE = Echo Time • Time from 90° pulse to the time after the 180° that the echo from the tissue is detected • TR = Repetition time • Time between pulses (ie ms spacing between 90°-180°-180° pulses)
TE governs T2 • Long TE allows for differences in T2 times to emerge. Water, with a long T2 time takes longer to decay and thus gives a stronger signal. T2 weighted = H20 bright • Using a long TE interval, tissues with long TE becomes brighter. A short TE would make long TE tissues dark
TR governs T1 • Tissue with a long TR (like water) takes a long time to recover to equilibrium • Using a short TR interval, tissues with short TR (like fat) have given off more signal (brighter) than a slower decaying tissue
PD weighting • Proton Density weighting • Density of spins or number of protons in a tissue • Short TE – decreases water signal • Long TR – decreases fat signal • Suppression of fat and water • Better anatomic detail
MRI Contrast • T2-weighting requires long TE, long TR • T1-weighting requires short TE, short TR • PD-weighting requires short TE, long TR
Figure 1. Representative axial brain images of the eight patients with ACA infarctions. Patient numbers appear in the upper left corner of each panel. Patient 1, T1-weighted axial MRI; patient 2, CT scan; patient 3, T2-weighted MRI; patient 4, T1-weighted MRI; patient 5, proton density MRI; patient 6, CT scan; patient 7, T2-weighted MRI; and patient 8, T2-weighted MRI.
MRA • Specific gradients are applied to phase and dephase the free H rapidly • H that is flowing into an area that was just dephased has not yet been dephased, thus producing high signal • This is repeated rapidly and flow can be monitored
Spin-Echo MRI • This “family” includes T1, T2 & Proton Density • RF pulses excite the protons to flip 90 degrees from the main magnetic field, then 180 degrees (to refocus the phase of precession). The first “echo” (RF from the tissue) is obtained. This first echo provides the data for either T1 or proton density contrast. To obtain the data for T2 contrast, a second 180 degree pulse is then applied to obtain a second “echo” • This is termed the 90-180-180 pulse train. • The times between the RF excitations (TR & TE) vary depending on the desired contrast. This produces various tissue signal intensity relationships which are referred to as “weighting” characteristics
Spin Echo • (Gp) phase encoding gradient (y plane) • (Gf) frequency encoding during signal detection • (Gs) slice-selection gradient during RF pulse to spin up and refocus only the slice of interest
Inversion Recovery/ IR • In this family the pulse train is 180-90-180 • the time of inversion / TI (“tee eye”) = the time between the first 180 and the 90 pulse • TI times can be tailored by suppressing signal from specific types of tissue. Greater contrast
STIR/Short TI Inversion Recovery • A short TI value suppresses the signal from fat and causes abnormal water destiny to “light up” brightly. • one of the best ways to image bone marrow and spinal cord pathology. (T2 with fat saturation also works well.)
T2W fast-spin echo with fat-sat (saturation>suppression) • shows normal meniscus, but increased signal at the posterior of the distal femoral metaphysis in teenager with a cortical desmoid
FLAIR= Fluid Attenuated Inversion Recovery • Long TI inversion recovery produces bright signal from brain pathology but CSF signal is suppressed • This allows better contrast of CNS lesions when they are located at CSF interfaces (common in MS)
True Inversion Recovery aka T1 FLAIR • New pulse sequence on 3T systems • Produces true anatomic contrast between grey vs. white brain matter
Gradient Echo or Field Echo • In this technique, the protons are excited to flip angles of less than 90 degrees (which is faster than SE) • instead of using a 180-degree refocusing RF pulse the precessions are “refocused” by reversing the polarity of the magnetic field gradient (The higher magnetic field side becomes the lower magnetic field side and vice versa.). • This can be used to rapidly produce extremely bright water signal in the CSF (the Rapid Myelographic technique) or in synovial fluid.
T2* (tee 2 star) gradient echo/GE with fat saturation • a variation of GE and FSE that suppresses the signal from fat while imaging fluids brightly but is extremely fast. • another fine technique for imaging bone marrow pathology and pathology of articular cartilage.
Gradient Echo or Field Echo • Rapid imaging produces myelographic effect • Sensitive to magnetic susceptibility (Hgb)
3D Imaging • This modification of Gradient/ Field Echo, and Fast Spin Echo/FSE, acquires data for imaging as a block or cube rather than as slices. The data can later be “cut up” into slices of any thickness in any desired plane. • Allows for ultra thin slice images (1mm or less) when necessary.
69 yr old patient presented with loss of consciousness. • A) CT demonstrates hypodensity consistent with infarction of basilar artery distribution in the left cerebellar lobe,vermis and medial portion of the right cerebellar lobe. • B,C) MRI FLAIR and MRI T2WI demonstrate vasogenic edema in the same distribution. • D) ADC map (b=1000) demonstrates diffusion restriction due to cytotoxic edema in the same distribution. • E,F) DWI (b=500, b=1000) also demonstrates diffusion restriction due to cytotoxic edema. • This case demonstrates acute infarction in the left and right cerebellar lobes and the vermis in a stage of intermixed vasogenic and cytotoxic edema.
What’s wrong here? MADDISON P et al. J Neurol Neurosurg Psychiatry 2000;69:563-564 ©2000 by BMJ Publishing Group Ltd