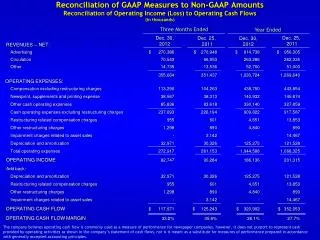
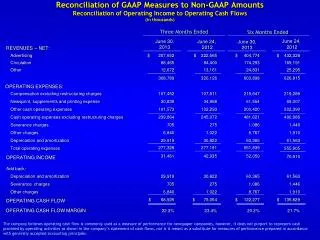
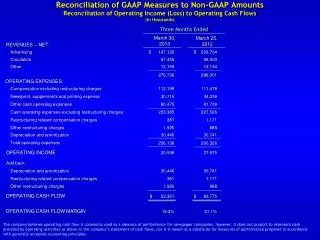
Download
1 / 20
200 likes | 363 Views
3. Pricing to Optimize Revenues. How should prices be set relative to cost – benefits? When should a firm lower or raise its prices? What is the reaction of competitors and customers likely to be when a firm adjusts its prices? When can a firm give away its products?.

E N D
3 Pricing to Optimize Revenues
How should prices be set relative to cost – benefits? When should a firm lower or raise its prices? What is the reaction of competitors and customers likely to be when a firm adjusts its prices? When can a firm give away its products?
A Brief History of Pricing • Barter • One-on-one bargaining • Menu (fixed) pricing • Auction pricing • Reverse auction
Setting Prices for anOptimal Revenue Model • Objective – to maximize profits • Contribution of Price to Profitability Profits = revenues - variable costs - fixed costs = PQ - VCQ – FC = ( P - VC)Q - FC = Contribution margin – FC = (Contribution margin per unit) Q – FC
The price (column A), per-unit variable cost (B), and quantity sold (C) are given. Revenues (E) are the product of price (A) and quantity sold (C). Variable costs (F) are the product of per-unit variable cost (B) and quantity sold (C). As defined in the text, the contribution margin (G) is equal to the revenues (E) minus variable costs (F). The product’s operating income is the contribution margin minus fixed costs. A B C D E F G H I Per-Unit Contribution Variable Quantity Margin Variable Contribution Fixed Operating Price Cost Sold per Unit Revenues Costs Margin Costs Profits A - B A X C B X C E - F G – H $100 $5 25,000 $95 $2,500,000 $125,000 $2,375,000 $10,000,000 $(7,625,000) 100 5 50,000 95 5,000,000 250,000 4,750,000 10,000,000 (5,250,000) 100 5 200,000 95 20,000,000 1,000,000 19,000,000 10,000,000 9,000,000) 100 5 500,000 95 50,000,000 2,500,000 47,500,000 10,000,000 37,500,000) 100 5 800,000 95 80,000,000 4,000,000 76,000,000 10,000,000 66,000,000) 100 5 1,000,000 95 100,000,000 5,000,000 95,000,000 10,000,000 85,000,000) 100 5 1,200,000 95 120,000,000 6,000,000 114,000,000 10,000,000 104,000,000) 100 5 1,500,000 95 150,000,000 7,500,000 142,500,000 10,000,000 132,500,000) 100 5 2,000,000 95 200,000,000 10,000,000 190,000,000 10,000,000 180,000,000) 100 5 2,500,000 95 250,000,000 12,500,000 237,500,000 10,000,000 227,500,000) Table 3.1 Contribution Margin and Profits as a Function of Number of Units Sold
Cost-Based Pricing A firm sets its prices by adding a markup to its costs or subtracting a markdown from the costs. • Markup over Cost • Return-on-Sales Markup • Return-on-Investment Markup • Contribution to Fixed Costs
Table 3.2 Price and Profits as a Function of Forecasted Sales
Customer Value-Based Pricing (1 of 10) • Price and Performance: Value-Based Fixed Pricing • The benefits (product characteristics) that customers value in the firm’s product. • The benefits from competitors’ products and their prices. • The firm’s pricing strategy.
Customer Value-Based Pricing (2 of 10)Figure 3.1 Honda, Nissan, and Toyota in the U. S. Luxury-Car Market
Customer Value-Based Pricing (3 of 10) • Customer Reservation-Price Pricing • The Appropriability Challenge • The Practicality Challenge • Segment Pricing • Quantity-Bought Pricing • Bundling • Two-Part-Tariff Pricing
Not all demand curves are linear and slope downward as in this example demand curves for luxury goods may slope upward since more people buy luxury items at higher prices. Customer Value-Based Pricing (4 of 10)Figure 3.AThe Appropriability Challenge
*For simplicity, we assume that when products are sold separately, each customer will buy only the product that he or she values most; Good = 30,000,000 x $60, Excellent = 20,000,000 x $70. Reservation Price Type of No. of Good + Firm’s Customer Customers Good Excellent Excellent Bundle Price Quantitative 20 mil $20 $70 $90 $85 Verbal 30 mil $60 $25 $85 $85 Revenues 1.8 bil* 1.4 bil* Total Revenues 3.2 bil 4.25 bil Customer Value-Based Pricing (5 of 10)Table 3.4 Bundling Example
Customer Value-Based Pricing (6 of 10) • Pricing Strategy • Price Cuts and Increases • Role of Price Elasticity of Demand • Competitors Reaction • Cost of Producing Extra Units
Customer Value-Based Pricing (7 of 10)Figure 3.2 Elastic Market
Customer Value-Based Pricing (8 of 10)Figure 3.3 Inelastic Market
Customer Value-Based Pricing (9 of 10) • Skimming • Penetration Pricing • Everyday Low Prices vs. Changing Prices • Pricing To Avoid Confrontation • Bundling and Two-Part-Tariff Pricing
Customer Value-Based Pricing (10 of 10)Table 3.5 Market Share and Profitability for Knowledge-Based Products 2002 2003 2004 Market Market Market Share Share Share Market (1000 Profits Market (1000 Profits Market (1000 Profits Share units) (millions) Share units) (millions) Share units) (millions) Firm A 050% 0,500 -$500 080% 8,000 $1,060 080% 80,000 $15,100 Firm B 050 0,500 -402.5 020 2,000 -110 020 20,000 3,400 Total 100 1,000 -902.5 100 10,000 950 100 100,000 18,500
Information Technology and Pricing(Back to the Future) • Impact On Determining and Capturing Reservation Price • Impact On Pricing Schemes
Pricing to Optimize Revenues ? Questions