Download
1 / 27
270 likes | 461 Views
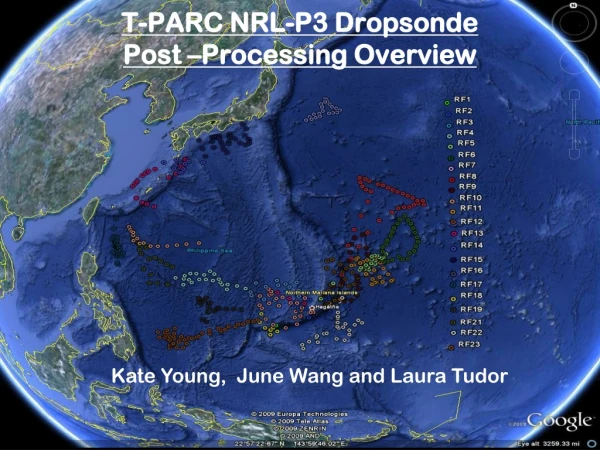
Impact of targeted dropsonde observations on the typhoon forecasts during T-PARC. Hyun Mee Kim, Byoung-Joo Jung, Sung Min Kim Dept. of Atmospheric Sciences, Yonsei University International Workshop on Advancement of Typhoon Track Forecast Technique 1 Dec. 2009 Tokyo, Japan. OUTLINE.

E N D
Impact of targeted dropsonde observations on the typhoonforecasts during T-PARC Hyun Mee Kim, Byoung-Joo Jung, Sung Min Kim Dept. of Atmospheric Sciences, Yonsei University International Workshop on Advancement of Typhoon Track Forecast Technique 1 Dec. 2009 Tokyo, Japan
OUTLINE 1. T-PARC activity 2. SV guidance 3. OSEs 4. Summary
1. T-PARC ACTIVITY • Provision of real-time adaptive observation guidance to ECMWF T-PARC DTS and JMA website • Implementation of observation system experiments
1. T-PARC ACTIVITY Configuration for real-time Sensitivity Guidance Model : MM5 Adjoint Modeling System with Lancoz Algorithm Domain : 50 x 50 x 14 (120 km) Norm : Dry-TE Two fixed target region : Taiwan , Japan Moist Basic-state with simple moist linear physics 48h optimization time with 48h lead time NCEP GFS data is used for initial and boundary conditions
1. T-PARC ACTIVITY 2008.04.21 Flowchart of Real-time SV sensitivity strategy 48 h 48 h Ti Ta Tv 00z 06z 12z 18z 00z 06z 12z 18z 00z Data download SV calculation Flight !!! Decision Pre-process Post-process Upload product to JMA & ECMWF DTS 0h 6h 16.5h 17.5h 6.5h
30 1 2 29 28 27 26 25 2. SV guidance for TC JANGMI (200815) DOTSTAR Obs.
UYonsei MM5SV NRL SV JMA SV ECMWF SV UMiami-NCEP ETKF UKMO ETKF 2. SV guidance for TC JANGMI (200815) ※Figures are from ECMWF DTS 0000 UTC 27 September 2008
TESVs for TC Jangmi (200815) • Shade : Total Energy distribution of SVs [ ]. • Blue Contour : Divergence in 300hPa [ ]. • Red Contour : Horizontal stretching (solid), Horizontal shrinking (dashed) [ ]. 1 PVU A1 A1’ A1 A1’ • Horizontal structure EXPJ1 06 SV composite +00h • Vector : Radial Wind in 950hPa.
TESVs for TC Jangmi (200815) • Shade : Total Energy distribution of SVs [ ]. • Blue Contour : Divergence in 300hPa [ ]. • Red Contour : Horizontal stretching (solid), Horizontal shrinking (dashed) [ ]. Angular Momentum Frontogenesis Saturated E.P.T. 1 PVU A3 A3’ C.S.I. A3 A3’ • Horizontal structure EXPJ3 03 SV composite +00h
TESVs for TC Jangmi (200815) EXPJ3 EXPJ1 +00h +24h_restriction +24h_whole +00h +24h_restriction +24h_whole • Vertical profile
3. OSEs • Modeling Systems • Physics configuration • Data used
3 day forecast 3 day forecast 3 day forecast 06 UTC 26 Sep 2008 00 UTC 28 00 UTC 27 12 UTC 27 12 UTC 26 3DVAR 3DVAR 3DVAR 3DVAR 3DVAR 3DVAR 3. OSEs • Experimental design 30 • 3 set of OSEs 1 29 28 27 26
① ② ③ ALL ALL ALL LAND LAND LAND+SV SEA ALL-DROP ALL-QSCAT ALL-SATEM 3. OSEs
3. OSEs : OBS distributions 00 UTC 27 Sep 06 UTC 27 Sep Targeted dropsonde SATEM QSCAT the others 12 UTC 27 Sep 18 UTC 27 Sep 00 UTC 28 Sep
3. OSEs : OBS distributions and Sensitivity guidance 00 UTC 27 Sep 06 UTC 27 Sep SV criteria 1. Interpolate SV to 0.5 degree grid 2. Top 10% of grids are selected. ( a tenth of grids) 12 UTC 27 Sep 18 UTC 27 Sep 00 UTC 28 Sep
3. OSEs : ① ALL, LAND, SEA 00 UTC 27 Sep 12 UTC 27 Sep 00 UTC 28 Sep
3. OSEs : ② ALL, ALL-DROP, ALL-QSCAT, ALL-SATEM 00 UTC 27 Sep 12 UTC 27 Sep 00 UTC 28 Sep
3. OSEs : ③ ALL, LAND, SEA, LAND+SV 00 UTC 27 Sep 12 UTC 27 Sep 00 UTC 28 Sep
Forecast Analysis Forecast Analysis Forecast 3. OSEs • In EnKF, flow-dependent forecast error covariance can be estimated with ensemble samples. • In ensemble square root filter (EnSRF), which is one of the deterministic algorithm of EnKF, apply reduced-Kalman gain for ensemble perturbations. T-∆T T T+∆T T+2∆T Configuration
2008/9/8 12z 9/9 00z 9/10 00z 9/11 00z 9/12 00z 06z 12z 18z 06z 12z 18z 06z 12z 18z 3. OSEs Experimental design DA FCST
3. OSEs Best track of SINLAKU from RSMC Tokyo
RMSE of prior ensemble RMSE of posterior ensemble Spread of prior ensemble Spread of posterior ensemble Bias of prior ensemble Bias of posterior ensemble 3. OSEs EnKF performance~ EXP1 verified with TEMP+DROP contemporary levels Observational error Prior ensemble spread + observational error
3. OSEs Rank Histogram ~ Reliability of ensemble Prior ensemble Without Obs Error With Obs Error Posterior ensemble Without Obs Error With Obs Error
3. OSEs Ensemble forecast ~ domain 1 initiated at 00 UTC 10 Sep 2008 EXP1 EXP2 EXP3 EXP1 EXP2 EXP3
3. OSEs Ensemble forecast ~ domain 2 initiated at 00 UTC 10 Sep 2008 EXP1 EXP2 EXP3 EXP1 EXP2 EXP3
4. Summary 1. We have provided the real-time SV sensitivity guidance to ECMWF DTS and JMA website during T-PARC period. 2. In the OSEs with conventional and targeted dropsonde observations, observations over the SEA area is more important than those over the LAND area in short-range track forecast of TC JANGMI(200815). 3. Among the observations over the SEA area, DROP is the most important in track forecast. 4. The SV sensitivity guidance is helpful for 1-day forecast, but the impact is reduced for 2-3 day forecast. 5. The positive impact of targeted dropsonde can be also found in ensemble forecasts. 6. More experiments for other T-PARC typhoons using other observations and data assimilation scheme are planned.