Download
1 / 43
430 likes | 448 Views
This Master's thesis evaluates a simulator-based program aiming to enhance risk awareness among novice drivers. The study compares the performance of trained experimental and control groups, highlighting the effectiveness of the training in improving hazard anticipation skills. The research explores the impact of combined training using plan views and a driving simulator on identifying risks in various scenarios. Results indicate significant improvements in risk perception and transfer of skills. The study addresses the challenges faced by young drivers and provides insights for enhancing driver training programs.

E N D
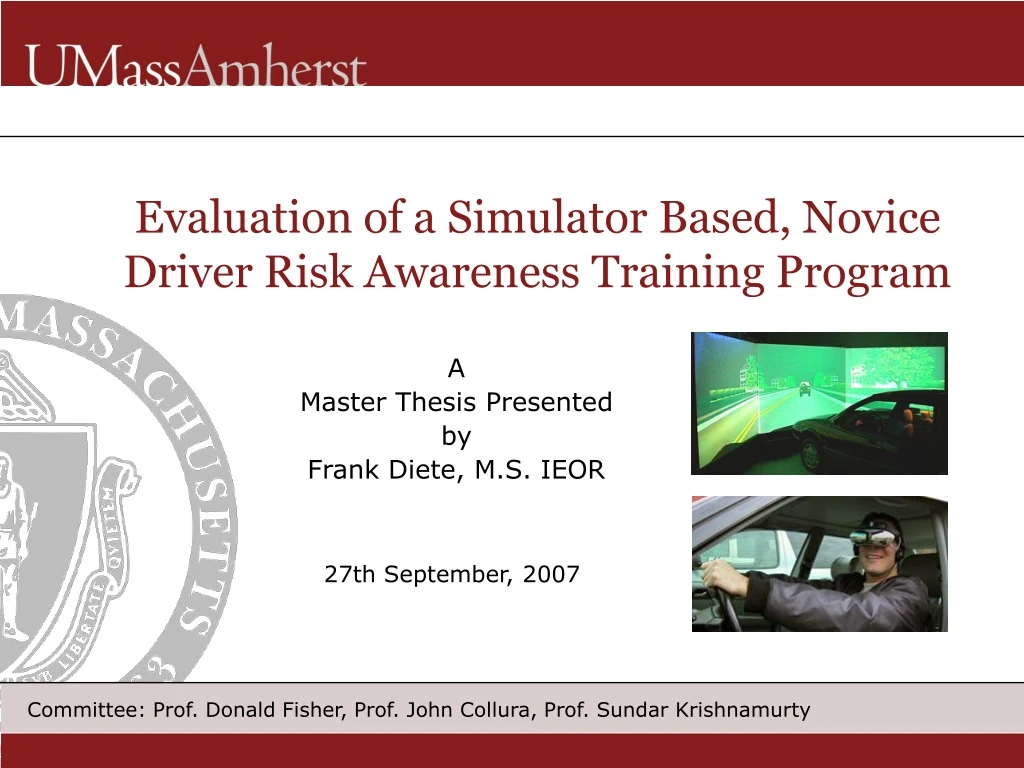
Evaluation of a Simulator Based, Novice Driver Risk Awareness Training Program A Master Thesis Presented by Frank Diete, M.S. IEOR • 27th September, 2007 Committee: Prof. Donald Fisher, Prof. John Collura, Prof. Sundar Krishnamurty
Outline • Review of Motivation • Experimental Design • Training Experimental Group • Training Control Group • Simulator Evaluation • Scoring and Results • Training Results • HPL Simulator Results • Conclusion
Background and Motivation Young, novice drivers are overrepresented in car crashes (Insurance Institute for Highway Safety (2006). Fatality Facts 2005: Older people. Retrieved July 6, 2007, from http://www.iihs.org/research/fatality_facts/olderpeople.html#sec0)
Field Studies Pradhan et al. (2005)* Police Accidents Reports (Mc Knight & Mc Knight, 2003) Eye Tracking Data - Scanning Patterns (Mourant and Rockwell (1972), Crundall & Underwood (1998)) Failures in Selective Attention Novice drivers do not show an appropriate tactical scanning behavior The reasons are failures in search Simulator Study (Pradhan et al. (2005)*) *Pradhan, A.K., Hammel, K.R., DeRamus, R., Pollatsek, A., Noyce, D.A., & Fisher, D.L. (2005). The Use of Eye Movements to Evaluate the Effects of Driver Age on Risk Perception in an Advanced Driving Simulator. Human Factors, 47, 840-852.
Risk Awareness and Perception Training (RAPT) RAPT-1 was developed and evaluated on the HPL driving simulator by Pollatsek et al. (2006)* • RAPT does … • … train novice drivers where to look • RAPT does not … • … train manual skills • … train time sharing skills After training 90% of critical areas in plan views could be identified by participants. *Pollatsek, A., Narayanaan, V., Pradhan, A., & Fisher, D.L. (2006b). The use of eye movements to evaluate the effect of PC-based risk awareness training on an advanced driving simulator. Human Factors, 48, 447–464.
22.3% 20.0% 24.6% Simulator Evaluation Results Total Effect of Training (57.7% vs. 35.4%) Near Transfer Scenarios (51.9% vs. 27.3%) Far Transfer Scenarios (63.5% vs. 43.5%) What explains this big difference in performance? • Difficulty to generalize from plan views to a • perspective view as seen on the driving simulator Pollatsek et al., 2006* 2) Necessity of practicing hazard anticipation at the same time as driving Multitasking does not occur automatically! Although 90% of risky areas could be identified in the training, only 52% of these areas were fixated in the evaluation! *Pollatsek, A., Narayanaan, V., Pradhan, A., & Fisher, D.L. (2006b). The use of eye movements to evaluate the effect of PC-based risk awareness training on an advanced driving simulator. Human Factors, 48, 447–464.
Link to proposed study RAPT* SIMRAPT Better Hazard Anticipation? A training program using both RAPT and the Drive Square simulator might result in better training effects. + = *Pollatsek, A., Narayanaan, V., Pradhan, A., & Fisher, D.L. (2006b). The use of eye movements to evaluate the effect of PC-based risk awareness training on an advanced driving simulator. Human Factors, 48, 447–464.
Experiment Research Hypotheses • Hypothesis 1: A training program using a combination of plan views (RAPT) and a head mounted driving simulator (SIMRAPT) will result in trained participants recognizing risks significantly more often on the HPL driving simulator than untrained novice drivers. The effects of training will generalize from the combined RAPT and SIMRAPT training program to scenarios on the HPL driving simulator that measure both the near and far transfer of the ability to recognize risks. • Hypothesis 2: The difference in performance between trained and untrained novice drivers using the combined RAPT/SIMRAPT training program will be larger than in past studies which used only the RAPT training program where performance in this and previous studies was evaluated on the HPL driving simulator using the same scenarios.
Outline • Review of Motivation • Experimental Design • Training Experimental Group • Training Control Group • Simulator Evaluation • Scoring and Results • Training Results • HPL Simulator Results • Conclusion
Experiment Design The effects of the training were evaluated by comparing simulator performance of a trained experimental and an pseudo-trained control group Participants • 16 or 17 years old • Less than 6 month driving experience Experimental Group Control Group (12 participants) (12 participants) RAPT-1 Mass RMV SIMRAPT Pseudo-SIMRAPT Compare HPL Simulator Evaluation HPL Simulator Evaluation
Participants Experimental Group Control Group 10 permit drivers 2 license drivers 10 permit drivers 2 license drivers 7 male 5 female 7 male 5 female Average Age: 16.5 years STDV: 0.4 years Average Age: 16.5 years STDV: 0.5 years
Experiment Design The effects of the training were evaluated by comparing simulator performance of a trained experimental and an pseudo-trained control group Participants • 16 or 17 years old • Less than 6 month driving experience Experimental Group Control Group (12 participants) (12 participants) RAPT-1 Mass RMV SIMRAPT Pseudo-SIMRAPT Compare HPL Simulator Evaluation HPL Simulator Evaluation
The slides for the RAPT PowerPoint were developed by Anuj Pradhan for prior studies. Training Program: Experimental Group RAPT Instructions Pre-Test / Training on 8 scenarios SIMRAPT Post-Test
yes no Training Program: Experimental Group RAPT Driver feels comfortable Practice Drive no yes Drive 1st scenario Written Instructions SIMRAPT Present plan view And feedback Drive next scenario no All scenarios driven? Correct head-turn done? yes End training Repeat scenario
Experiment Design The effects of the training were evaluated by comparing simulator performance of a trained experimental and an pseudo-trained control group Participants • 16 or 17 years old • Less than 6 month driving experience Experimental Group Control Group (12 participants) (12 participants) RAPT-1 Mass RMV SIMRAPT Pseudo-SIMRAPT Compare HPL Simulator Evaluation HPL Simulator Evaluation
Training Program: Control Group Mass RMV Training Drive Square Simulator Nothing related to hazard anticipation
Training Program: Control Group Mass RMV Training Driver feels comfortable Practice Drive yes no Drive all 8 scenarios one after another Written Instructions Drive Square Simulator No feedback given Drive all 8 scenarios again in another order End training
Experiment Design The effects of the training will be evaluated by comparing simulator performance of a trained experimental and an pseudo-trained control group Participants • 16 or 17 years old • Less than 6 month driving experience Experimental Group Control Group (12 participants) (12 participants) RAPT-1 Mass RMV SIMRAPT Pseudo-SIMRAPT Compare HPL Simulator Evaluation HPL Simulator Evaluation
HPL simulator evaluation Both the experimental and the control group were evaluated on the HPL driving simulator • Evaluation immediatly after the training • Instructions „obey traffic laws etc.“… • Calibration of the eye-tracker • Participants are asked to follow a lead vehicle • Practice Drive • 16 Scenarios in four blocks 8 near and 8 far transfer scenarios* *The scenarios for the simulator evaluation had been developed by Anuj Pradhan at the Human Performance Lab for prior studies.
Outline • Review of Motivation • Experimental Design • Training Experimental Group • Training Control Group • Simulator Evaluation • Scoring and Results • Training Results • HPL Simulator Results • Conclusion
SIMRAPT Results – Experimental Group Sequences of scenarios in SIMRAPT: 1st participant: 1 – 2 – 3 – 4 – 5 – 6 – 7 – 8 2nd participant: 2 – 3 – 4 – 5 – 6 – 7 – 8 – 1 3rd participant: 3 – 4 – 5 – 6 – 7 – 8 – 1 – 2 ….. Scoring in SIMRAPT: • 0, 0.5 or 1 point for each scenario and drive • Number of trials counted for each scenario and drive
SIMRAPT Results – Experimental Group 2.58 79% 1.33 0% Average Score first trial Average number of trials
SIMRAPT Results – Experimental Group Average Score first trial Average number of trials
Drive Square Results – Control Group Average Score 1st and 2nd run by scenario. Slight improvement from 8.9% to 14.1%, but not significant (t=1.93, p>.05)
Conclusion of training results • High and significant training effect for the experimental group from the 1st to the 8th drive on SIMRAPT Generalization within training • Tendency of small training effect for control group from 1st to 2nd run on Drive Square
Outline • Review of Motivation • Experimental Design • Training Experimental Group • Training Control Group • Simulator Evaluation • Scoring and Results • Training Results • HPL Simulator Results • Conclusion
HPL Simulator Evaluation - Scoring Each scenario* was scored 1 or 0 depending on eye fixation behavior! *The scenarios for the simulator evaluation had been developed by Anuj Pradhan at the Human Performance Lab for prior studies.
Near Transfer – Opposing Truck Left Turn scenario Risk Recognized Risk Not Recognized *The scenarios for the HPL driving simulator that are used for this study and the slides for the Power Point Training had been developed by Anuj Pradhan at the Human Performance Lab within the last years.
Far Transfer – Mullins Center scenario Risk Recognized Risk Not Recognized *The scenarios for the HPL driving simulator that are used for this study and the slides for the Power Point Training had been developed by Anuj Pradhan at the Human Performance Lab within the last years.
Results for simulator evaluation Test of Hypothesis 1: Significant training effect of combined training program? All 16 scenarios included in evaluation!
Results for simulator evaluation Pretty consant training effect for all near transfer scenarios Generalization only for particular far transfer scenarios
Results for simulator evaluation Test of Hypothesis 2: Training effect of combined training program higher than for just PC-based training as in Pollatsek et al. (2006)? 11 scenarios included in evaluation!
Results for simulator evaluation The non-published variances and means for the RAPT-1 evaluation are based on former work at the Human Performance Lab and were provided for use in this study by Anuj Pradhan, graduate student at UMASS Amherst.
Results for simulator evaluation The non-published variances and means for the RAPT-1 evaluation are based on former work at the Human Performance Lab and were provided for use in this study by Anuj Pradhan, graduate student at UMASS Amherst.
Results for simulator evaluation The non-published variances and means for the RAPT-1 evaluation are based on former work at the Human Performance Lab and were provided for use in this study by Anuj Pradhan, graduate student at UMASS Amherst.
Outline • Review of Motivation • Experimental Design • Training Experimental Group • Training Control Group • Simulator Evaluation • Scoring and Results • Training Results • HPL Simulator Results • Conclusion
Conclusions • RAPT/SIMRAPT Ability to fixate on areas of potential risk on HPL driving simulator Training succeeded for particular scenarios • RAPT Recognize Risks from Plan View • SIMRAPT Ability to recognize risks in driving task on Drive Square Simulator • Training effects exceed those of PC Training, though not significantly
Suggestions for future research • Generalization Deversify training • Duration of the training Redesign Training • Effects of simulator driving for control group More extensive study necessary
Thank you for your attention Any Questions? Additions? Suggestions?