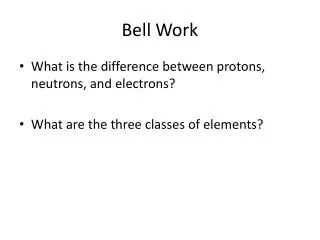
Bell Work
Bell Work. List 2 sister groups in the phylogeny. . Intro to Biology – Lecture 60. Cladograms. Cladogram. A diagram used to show relations among organisms . What Does a Cladogram Look Like?. Uses lines that branch off in different directions ending at groups of organisms.

Bell Work
E N D
Presentation Transcript
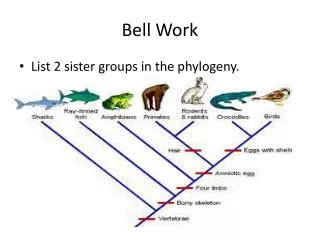
Bell Work • List 2 sister groups in the phylogeny.
Intro to Biology – Lecture 60 Cladograms
Cladogram • A diagram used to show relations among organisms.
What Does a Cladogram Look Like? • Uses lines that branch off in different directions ending at groups of organisms. • Many shapes but all have lines that branch off from other lines. • The lines can be traced back to where they branch off.
Branching Off Points • Branching off points represent a hypothetical ancestor which would have the combined traits of the lines above it. • This hypothetical ancestor might then provide clues about what to look for in an actual evolutionary ancestor.
How are Cladograms Made • Originally – made by observing morphological characteristics • Today – made by sequencing DNA and RNA
Minor Differences Between Cladograms and Phylogeny Phylogeny Cladogram Branch length has no relevance to time. Attempts to trace evolutionary relationships directly by analyzing gene sequences. Traces the sharing of derived characters. Does not show how ancestors are related to descendants or how much they have changed • The length of branches represents the time for a species to change. • Relates organisms based on comparisons of the similarities/dissimilarities of their anatomies. • Measures degrees of similarity. • Concerned with who appears most similar to whom at one point in time.
Cladogram and Phylogeny • Often the two methods give the same tree, but sometimes they differ because of the minor differences in the way they are formed.
Cladogram and Phylogeny • For the purpose of this class, we will assume that the two are the same.