Download
1 / 17
170 likes | 199 Views
Explore how the Bird Atlas, a comprehensive bird mapping project, utilizes web technology to improve efficiency, accuracy, and validation processes. Discover the benefits, challenges, and potential of incorporating mobile technologies. Learn about the Atlas's objectives, data validation, and the transition from paper to digital platforms. Gain insights into the significance of online contributions, validation systems, and the future integration of mobile devices. Uncover opportunities and considerations for further technological advancements in bird monitoring.

E N D
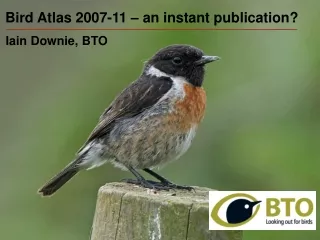
Bird Atlas 2007-11 – an instant publication? Bird Atlas 2007-11 – an instant publication? Iain Downie, BTO
Using Atlas as an example of how the web has improved efficiency/accuracy • How the web has improved Atlas validation? • Can mobile technologies help? • What is ‘the Atlas’? • Why do it?
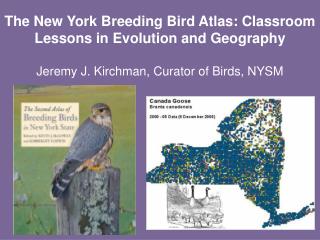
1988-91 1981-84 1968-72 ? 2007-11 40+ local atlases running in parallel
Atlas aims • Map all species in Britain and Ireland • Complete coverage, not sampling specifics • Winter and breeding seasons • Estimate relative abundance • Assess changes in range • Attempt population estimates • Set conservation priorities • …..and lots more stuff….. • A lot of effort from a lot of people! • Part of broader programme of surveys
Some facts and figures: 2007-11 window • 155,797 Timed Tetrad Visits (structured survey***) • Topped up by… • 6.3 million Roving/Casual Records… • & other surveys (Ringing, Breeding Bird Survey) • 15,419 online contributors (> 91% data online) • For us: Lower overall costs (% of total budget) 3% = inputting data from paper forms 8% = online development and support ~30% = estimated inputting cost if all via paper
Amongst the many online benefits • For the user: Easy data-entry, interrogation and instant feedback on all their data • Management Systems • Validation Systems • During data entry (Jack Snipe?) • Review by network of experienced regional volunteers • Auto-validation • 80% records already fully validated by local experts
Common problems need validation Mistaken identification Incorrect grid references Clicked on wrong species name Unusual numbers (extra 0?) Unusual breeding status (only 0.07% of records in state of query) NON!
The validation process…. Observer POSTS to RO Season records POSTED to BTO Collate & visual checks POST to data input firm Records checking (Fortran) Regional data POSTED to RO for more checking POSTED back to BTO with corrections Fieldwork complete, Species Maps created, BTO visual checks Master copies POSTED to RO, more checking Corrected copies POSTED to BTO Final maps produced (two years later!) Publication Typical previous atlases 3 times!
The validation process…. Log on as RO Open validation module Target new records entered over last few days Validate sensible records and let nightly auto-validation do the rest Log off, watch Strictly…. 2007-11
Typical validation page • Records into data…. • Greater confidence in provisional maps? • Easier/faster migration to final product (web and ISBN)
Clear benefits to online but…. • >4000 online registrations who did nothing – why? • 9% data via paper from 6% of recorders (one dissident regional organiser) • Online system high start up costs • Typically longer lead in time (IT development) • Typically need ‘enterprise capability’ • Prioritisation of “wish list” of features • As with paper, maintenance continues after field work ends (many local atlases using software to continue their recording - BTO commitment)
So now we know web better than paper… …where will technology take us (BTO)? • Mobile devices an obvious next step • ‘Smartphones’ increasing steadily (38% of handsets and 64% of contracts - UK, April 2010) • How much benefit can they really provide?
Costs and issues (for BTO?) • Fast moving volatile technology: Pick a platform, any platform…e.g. iPhone one year ago… • New development cycle needed – training and some specialist setup for applications (c.f. http) Recent US contracts
Costs and issues (for BTO?) • Can’t replicate entire web – focus effort • Database integration essential to provide context, validation and extension to the existing systems • Development could wipe out cost savings • Reception improving, but still variable • GPS only partially useful (less so with ranging birds, better for nests, plants?) • Information gain varies with taxa • Structured surveys (our core methodologies) are more difficult to envisage on phone (but iPads?)
Opportunities? • One of a number of tools available • Casual/Roving records certainly (Fiona) • Accessible field guides (e.g. id and maps) and webs service access to improve context • Training tools to improve recording • Assist in structured surveys (e.g. mapping and transect sections, accurate locations, habitats) • Tracking observer behaviour? • Voice recognition data entry • Call and photo recognition?
Thanks! 1956 SRA/Ericsson MTA 16kg!!