GDP Data and Total Factor Productivity Analysis
GDP Data and Total Factor Productivity Analysis. Apichai Thamsermsukh National Accounts Office, NESDB. ประเด็นนำเสนอ : ความสัมพันธ์ระหว่าง GDP และ Total Factor Productivity (TFP) การประมวลผล GDP ภาคบริการ. Total Factor Productivity (TFP). Labor Productivity (LP) LP = value added

GDP Data and Total Factor Productivity Analysis
E N D
Presentation Transcript
GDP Data and Total Factor Productivity Analysis Apichai Thamsermsukh National Accounts Office, NESDB
ประเด็นนำเสนอ: ความสัมพันธ์ระหว่าง GDP และ Total Factor Productivity (TFP) การประมวลผล GDP ภาคบริการ
Total Factor Productivity(TFP) Labor Productivity (LP) LP = value added labor (Employment) Capital Productivity (CP) CP = value added net capital stock
Total Factor Productivity (cont.) TFP = GDP growth – CE * Labor growth GDP(VA) – (VA – CE) * Capital growth GDP(VA)
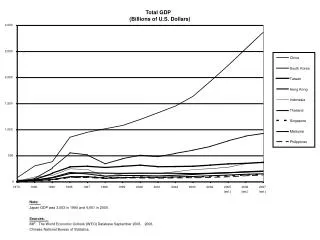
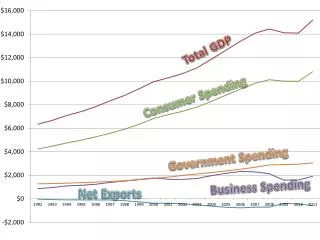
GDP Compilation Value Added (VA) =Gross output (GO)–Intermediate Cost (IC) • VA i=GOi – ICi • GDP = Gross Domestic Products • VA = Value Added • GO = Gross Output • IC = Intermediate Cost • i = Goods and services1,2,3,…,n n GDP = VA i i =1
GDP at current prices and constant prices มูลค่าเพิ่ม ณ ราคาประจำปี = มูลค่าการผลิตในราคาปีปัจจุบัน – ค่าใช้จ่ายขั้นกลางในราคาปีปัจจุบัน มูลค่าเพิ่ม ณ ราคาคงที่ = มูลค่าการผลิตในราคาปีฐาน –ค่าใช้จ่ายขั้นกลางในราคาปีฐาน VAt (current prices) = GOt – ICt GOt = (Q t x POt) ICt = (q t x PCt ) VACt(constant prices) = GOCt – ICCt GOCt = (Q t x POo) ICCt = (q t x PCo)
มูลค่าการผลิต (Gross output : GO) Services sectors มูลค่าการผลิต = รายได้จากการดำเนินงาน GO= Income from operation
GDP at constant prices Services sector มี 2 วิธี • Base-year valuation of quantity (Quantity index) VAconstant = Σ V0 Qt Q0 • Price deflation (Price index) VAconstant = ΣVtxP0 Pt
Constant values for 4 industries • Base-year valuation of quantity Trucking ใช้ ton-kilometers Airlines ใช้ RPK(Revenue Passenger Kilometres) • Price deflation Banking ใช้ CPI all commodity Telecom แบ่งเป็น Fixed line ใช้ CPI ค่าใช้บริการโทรศัพท์ Mobile ใช้ ARPU