Download
1 / 30
300 likes | 442 Views
Taking the Nation’s Pulse. GDP – Measuring Total Production and Income. Chapter 8. A Measure of Output. Gross Domestic Product (GDP): The market value of final goods and services produced within a country during a specific time period , usually a year. GDP vs GNP??.

E N D
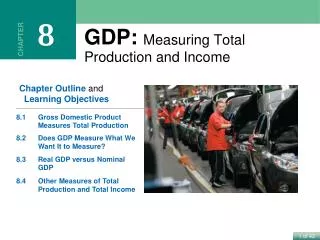
Taking the Nation’s Pulse GDP – Measuring Total Production and Income Chapter 8
A Measure of Output • Gross Domestic Product (GDP): The market value offinal goods and servicesproducedwithina country during aspecifictime period, usually a year. GDP vs GNP?? • GDP: production within a country’s borders(domestic) • GNP: production by people of a country(national)
$.30 $.30 Sales Receipts Value added to the product $.65 $.35 (equals income created) Stage of production (at each stage of production) $.90 $.25 by farmer $.10 $1 by miller Stage 3:baker’s bread by baker (wholesale) Stage 4:grocer’s bread by grocer (retail) Total value added = $1 Total consumer expenditure = $1 A Measure of Output Only final goods and services count • What Does Not Count Toward GDP? • Sales at intermediate stages of production. Their value is already counted in the final-user good. Including them would result in double counting. Stage 1: farmer’s wheat Stage 2:miller’s flour
A Measure of Output • What Else? • Financial transactions and income transfers. They do not reflect production. • Production outside the geographicborders of the country is not counted. • Goods not produced during the current period are not counted. Stocks 1955 Chevy
Which are included in this year's GDP? : • 1. Interest on an AT&T bond - • 2. Social Security payments to retirees - • 3. Services of a painter in painting a house - • 4. Income of a dentist - • 5. Money received from the sale of a 1990 model car- • 6. Monthly allowance of a college student - • 7. Rent for a 2 bedroom apartment - • 8. Money received for selling this year's model car - • 9. Interest on a government bond - YES NO YES YES NO NO YES YES NO
Which? • 10. A two hour decline in the work week - • 11. Purchase of the AT&T bond - • 12. A $ 2 billion increase in business investments - • 13. Purchasing 100 shares of GM common stock - • 14. Purchase of an insurance policy - • 15. Wages paid to your butler - • 16. Market value of a homemaker's services - • 17. Purchase of the Mona Lisa - NO NO YES NO YES YES NO NO
A Measure of Output • GDPis measured in dollars • Each good produced increases output by the amount the purchaser paysfor the good. GDPis the sum of total spending on all goods and services produced during the year.
Three Two Ways of Measuring GDP E xpenditures I ncomes O utput (Value Added)
Dollar flow ofincome(and indirect cost) of final goods GDP = Dollar flow ofexpenditureson final goods = Measuring GDP • 1. Expenditure Approach: • GDP is the sum of expenditures on final user goods and services purchased by households, investors, governments, and foreigners. • There are four components of GDP: • personal consumption purchases C • gross private investment Ig(including inventories) • government purchases G (consumption and investment) • net exports ( exports minus imports )Xn
Figure 8.2 Components of GDP in 2010 Consumption accounts for 70.5 percent of GDP, far more than any of the other components. In recent years, net exports typically have been negative, which reduces GDP. .
Will U.S. Consumers Be Spending Less? Consumption is a larger fraction of GDP in the United States than in most other high-income countries or in rapidly growing countries such as China and India. Over time, consumption in the United States has increased as a fraction of GDP. Although it can be good news for the economy in the long run, the determination of U.S. households to cut back on spending and increase saving in 2011 may partly explain the slow recovery from the 2007–2009 recession.
Sum of these = national income • 2. Resource Cost - Income Approach • GDP is the sum of costs incurred and income (including profits) generated by production of goods and services during the period. a. The direct cost income components of GDP: • employee compensation Labor • self-employment income labor/entrepreneur • rents land • Interest capital • corporate profit entrepreneur
2. Resource Cost - Income Approach: (cont.) Not covered
When derived byResource Cost - Income Approach,GDP is equal to: • national income(employee compensation, self-employment income, rents, interest, corporate profit) • indirect business taxes • depreciation • net income of foreigners
$.30 $.30 Sales Receipts Value added to the product $.65 $.35 (equals income created) Stage of production (at each stage of production) $.90 $.25 by farmer $.10 $1 by miller Stage 3:baker’s bread by baker (wholesale) Stage 4:grocer’s bread by grocer (retail) Total value added = $1 Total consumer expenditure = $1 • 3. Output – by Industry (Value Added) • Add up output by each industrial sector • Chemicals + Agriculture + … Stage 1: farmer’s wheat Stage 2:miller’s flour
Measuring GDP Using the Value-Added Method Value added The market value a firm adds to a product. Calculating Value Added The price of the shirt on L.L.Bean’s Web site is exactly equal to the sum of the value added by each firm involved in the production of the shirt.
Shortcomings of GDP: • It does not count non-market production. • It does not count the underground economy. • It makes no adjustment for leisure. • It probably understates output increases because of the problem of estimating improvements in the quality of products. • It does not adjust for harmful side effects. • It does not consider standard of living – GDP per person • Great contribution of GDP: • In spite of its shortcomings, real GDP is a reasonably accurate measure of short-term fluctuations in output. Shortcomings and Strengths of GDP as a Measuring Rod
The term "real" means adjusted for inflation. • Price indexesare use to adjust data for inflation. • A price index measures the cost of purchasing a good (or goods) at a point in time relative to the cost of purchasing the identical good during an earlier (or base) period. Real and Nominal GDP
Creating a price index Year $ Spending Index 1 170 _____ 2 180 _____ 3 Base year 200 _____ 4 200 _____ 5 224 _____ 6 250 _____ 7 280 _____ Current year spending Base year spending x 100
Two Key Price Indexes: • measures the impact of price changes on the cost of a typical bundle of goods and services purchased by households. Consumer Price Index • designed to measure the change in the average price of the market basket of goods included in GDP (a broader price index than the CPI). GDP Deflator
Other Indices 1. PPI 2. WPI 3. MPI
GDP Deflator1 GDP Deflator2 Real GDP2= Using the GDP Deflator to Derive Real GDP • The formula for converting the nominal GDP into real GDP is: Nominal GDP2 * • Data on both money GDP and price changes are essential for meaningful comparisons of output between two time periods.
price indexcurrent year Figurecurrent $= price indexearlier year Converting Earlier Figures to Current Dollars • For comparisons across time periods, we must use current dollars. • Done by “inflating” the earlier data for the increase in the price level. • The formula: Figureearlier $ * • This will “inflate” the data for earlier years into line with the current purchasing power of the $.
Gross Domestic Product Complete the following table assuming that Year 1 is the base year.
Gross Domestic Product Complete the following table assuming that Year 1 is the base year.
Gross National Product (GNP): Output by the “nationals” – citizens of the country, regardless of whether that output is produced domestically or abroad. • National income: Income earned by the nationals (citizens) during a period. It is the sum of employee compensation, self-employment income, rents, interest, and corporate profits.Minus depreciation and taxes • Personal income: Income received by domestic households and non-corporate businesses. It is available for consumption, saving, and personal taxes. Includes transfers. • Disposable income: Income available to individualsafter personal taxes.Can be spent on consumption or saved. Related Income Measures
Nominal GDP Nominal GDP Nominal GDP Price index Price index Price index Real GDP Real GDP Real GDP (billions of U.S. $) (billions of U.S. $) (billions of U.S. $) (GDP deflator, 2000 = 100) (GDP deflator, 1996 = 100) (GDP deflator, 2000 = 100) (billions of 1996 $) (billions of 2000 $) (billions of 1998 $) 100.0 100.0 96.5 109.4 106.0 116.0 16.0% 9.8% 9.4% Source: http://www.economagic.com. Source: http://www.economagic.com. Source: U.S. Department of Commerce. Deriving Real GDP 1996 $7,813 $7,813 2001 $10,208 $9,331 % increase 30.7% 19.4% 1998 $8,747 $8,747 2003 $11,004 $10,018 % increase 25.8% 14.5% 2000 $9,817 $9,817 2006 $13,247 $11,420 % increase 34.9% 16.3% Like “Deflating” the $
Interesting Questions 1. The CPI was 177 in 2001 compared to 100 in 1983. Suppose that the price of a ticket at a local movie theater rose from $4 to $8 between 1983 and 2001. Did the real ticket price increase or decrease? Calculate the 1983 ticket price measured in 2001 dollars. 2. The CPI was 210 in 2007 compared to 100 in 1983. Suppose that the price of a ticket at a local movie theater rose from $4 to $8 between 1983 and 2007. Did the real ticket price increase or decrease? Calculate the 1983 ticket price measured in 2007 dollars.
GDP Comparisons Across Time Periods and Across Countries
1. Which of the following activities will affect GDP: a. You pay $600 per month to lease an apartment. b. You pay $8,000 to purchase a four-year-old car. c. You have car trouble and have to pay a repair shop $1,500 to fix the transmission of your car. d. You pay $5,100 to purchase 100 shares of Microsoft stock ($50 per share for the stock plus a $100 fee). e. You sell your 100 shares of Microsoft stock (purchased for $5,000) for $6,000 minus a $100 brokerage fee. f. Your aunt sends you $500 to help with your expenses. g. You earn $500 providing computer services for a faculty member. h. You win $500 playing cards with classmates.