Download
1 / 71
710 likes | 733 Views
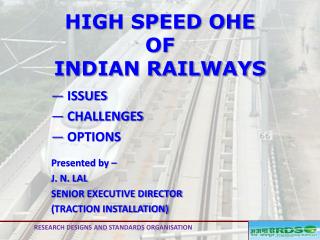
Analysis of Productivity and Costs across the Indian Zonal Railways 1981-82 through 2002-03. Presentation NAIR, Vadodoara 5 th February, 2014 Dr G. Alivelu Uma SivaPrasad Associate Professor Centre for Economic and Social Studies, Hyderbad. Why Indian Railways.

E N D
Analysis of Productivity and Costs across the Indian Zonal Railways1981-82 through 2002-03 Presentation NAIR, Vadodoara 5th February, 2014 Dr G. Alivelu Uma SivaPrasad Associate Professor Centre for Economic and Social Studies, Hyderbad
Why Indian Railways • Railways - key determining player of Indian economy • A number of technological advancements have taken place • Few studies on Indian Railways • Detailed analysis of productivity trends and cost estimates of Zonal Railways - not carried out
Objectives i. To measure and analyze partial productivities and TFP of Indian Railways and nine zonal railways • To identify - sources of TFP growth on Indian and zonal railways • To estimate and analyze cost structure of Indian Railways
Focus of the study • Analyze nature and rapidity of technological change on Indian Railways - estimation of a cost function • Investigate substitution possibilities among three factors of production - labor, fuel and capital inputs
Review of Literature • Fuchs (1965), Deakin and Seward (1969), Meyer and Morton (1975), Mark (1983) did not consider heterogeneity of rail output dependence on partial productivity indices, - labor productivity • McGeehan (1993) - productivity growth in Irish railways 1973-83, using translog - growth in productivity - reductions in fleet size and labor, increases in traffic
T.H. Oum C. Yu (1994) - productive efficiency of railways in 19 OECD countries (i) high dependence on public subsidies less efficient than similar railways with less dependence on subsidies (ii) high degree of managerial autonomy from regulatory authorities - higher efficiency
Oum and Yu (1994) - changes in technical efficiency - a sample of European railway companies using non-parametric approach • Gathon and Pestieau (1995) and Cantos and Maudos (2000) estimate production and cost functions of a stochastic nature allowing advances in productivity to be decomposed into technical change and changes in efficiency
Kishan Rao (1975) uses Solow index of productivity to obtain TFP for period 1951-74. Uses two alternative measures of output - monetary (GVA), physical (P&F) Growth rate of productivity is 0.9% per year during 1951-74 • Capital saving technical progress took place on IR
Brahmananda (1982) calculates partial factor productivities and Kendrick index of TFP for IR for 1950-51, 1960-61, 1970-71 and 1980-81. TFP increased by 1.2%per year on an average • Sailaja’s (1988) study is an improvement over previous studies as she considers heterogeneous nature of outputs and inputs
Caves, Christensen and Swanson’s (1981) study of class-I US railways during 1955-74 study productivity growth, scale economies and capacity utilization. A multi-product variable cost function is estimated
Pedro Cantos, José M. Pastor and Lorenzo Serrano (2002) analyze cost and revenue inefficiencies for a sample of European railway companies • Using DEA model, authors calculate cost and revenue inefficiencies, decomposing them into inefficiencies of a technical or allocative type
Inefficiencies in revenues are greater than those in costs • Technical inefficiencies are greater than the allocative type • Independent companies - with least external intervention in their decisions, are also the most efficient in both costs and revenue
Dhrymes and Kurz (1964), Dhrymes (1963), McFadden (1963) use Constant Elasticity of Substitution (CES) function • Nerlove (1963) recognizes heterogeneity of capital and labor inputs. Both materials and energy are included as inputs. He makes use of the generalized Cobb-Douglas form to study the cost function
Klein (1962) studies cost function of railway transportation using Cobb-Douglas production function
IR- Management • Minister of Railways • Two Ministers of State for Railways • Railway Board (Chairman + Six Board Members) • Nine Zones (General Manager) • Sixty Seven Divisions ( Divisional Railway Manager)
Methodology Estimate total factor productivity and costs • Tornquist index for productivity – (i)superlative index (ii)consistent with methodology underlying translog functional form • Translog function for estimating cost
Valid cost function (i) cost function must be non-decreasing in factor prices (ii)homogeneous of degree one in factor prices (iii)cost function must be concave in factor prices (iv) continuous nature of prices
Why Tornquist index • Cost shares - used as weights to aggregate input growth rates wherein each class of input is weighted based on its contribution to total cost • index does not impose separability assumptions either on outputs or inputs • Weights used both for inputs and outputs changed annually • assumption of neutrality of technical change is relaxed
Why not a Production Function? • Cost minimization appears to be a reasonable assumption in case of Indian Railways • Estimation of cost function proceeds on assumption that input prices are exogenous whereas estimation of production function takes input quantities as exogenous. Since railways are a public utility, it is more likely that factor prices are more exogenous than factor inputs • Parameters like elasticities of substitution can be estimated more easily from estimates of TL cost function
Why Translog Cost Function • does not make a priori assumptions with respect to separability, substitution and transformation, returns to scale
List of Variables - TFP • To measure TFP growth, measurement of both input and output growth becomes essential • Present study takes into consideration - time series data on three inputs and two outputs • Data for above variables is collected for the period 1981-82 to 2002-03 across Indian zonal railways
List of Variables – Cost Function • Two outputs - passenger and freight • Three inputs - labor, capital and fuel • Prices of inputs • Total Costs
Outputs Two • Freight Output (Y1) – Net Ton Kilometres (NTKM) NTKM : number of tons of freight carried multiplied by average distance over which it is transported • Passenger Output (Y2) – Passenger Kilometres PKM: total number of passengers multiplied by average distance over which they travel
Freight components • coal, food grains, iron and steel, iron ore and other ores, cement, mineral oils, fertilizers, limestone and dolomite, stones (including gypsum) other than marble, salt, and sugar • Aggregated using their corresponding revenue shares as weights
Passenger components • Sub-Urban (all classes) Upper class (includes Air Conditioned, First class), Mail/Express (now includes also Sleeper class) and Ordinary (includes General Class) • Weights - assigned to each of four classes in sub-urban and non sub-urban classes in proportion to revenue shares of each of these in total passenger output
Inputs Labor • Group A & B : Managerial • Group C : Skilled Staff (Supervisory) • Group D : Semi / unskilled staff (Artisan) Fuel • Coal, diesel and electricity Capital • Structural engineering works • Rolling Stock • Equipment
Tornquist index TFP = ln TFP (T) – ln TFP (T-1) 3 - = Σ VjT [lnYj (T) – lnYj (T-1)] - Σ WiT [lnXi (T) – lnXi (T-1)] Yj - jth output, Xi - ith input Ln (YT/YT-1) = VjT [lnYjT – lnYj (T-1)] VjT = ½ [Vj (T) + Vj (T-1)] VjT value share of jth output in total output in year T
Output index Growth rate of output Y in time period T is given as: 2 ־ • YT = VjT [ln Yj (T) – ln Yj (T-1)] j=1 Where,VjT = ½ [Vj (T) + Vj (t-1)] • Where, VJ represents the revenue share of jth output obtained
Output indices • Let Yjm (T) be the mth component of jth output in year T. Then the jth output in year T, Yj (T) is defined as Mj • Yj (T) = Yjm (T) m=1 • j = 1 = 2 = freight output = M1 = 11 • passenger output M2 = 4
Input indices • XiT* = ln Xi (T) – ln Xi (T-1)־ • wnT (ln Xin (T) – ln Xin (T-1) • n winT = ½ [win (T) + win (T-1) winT - value share of nth class of input in ith input in Tth year • Xin’s - individual quantities of nth class of input in ith input in Tth year
Input growth rate growth rate of heterogeneous input is then obtained as: • ▪ 3 • XT* = WiT XiT* i=1 • WiT - average cost share of ith input in Tth year
Price indices Let, Ni • PiT = PinT (31) n=1 • PiT = ln Pi (T) – ln Pi (T-1)
Labor Price Index • Average annual wage per employee in each group - labor expenditure divided by corresponding figure of number of persons employed in each of the three groups • Price index of labor - derived by dividing total expenditure on labor by total number of labor
Fuel Price Index • Fuel input consists of coal, diesel and electricity • Weighted price index for fuel - dividing expenditure on fuel by total fuel consumed
Capital Price Index The Perpetual Inventory Method is used to create real capital stock • AnT = B n (T) – B n (T-1) • InT = AnT/qnT T • KnT = Gn60 + Σ Inc 3 • KT = Σ KnT n=1 • K T* = lnK (T) – lnK (T-1) • PknT = qn(T-1) rT + qnT dnT – [qnT – q n(T-1) ]
Sources of Data • outputs, labor, fuel - Annual Statistical Statements, IR Yr Books • Capital - Annexure ‘G’ Appropriation Accounts, Works, Machinery and Rolling Stock Programs published by the Railway Board, Capital Restructuring on IR, Report of the Working Group on Depreciation, Currency and Finance Report by RBI • Capital price - Chandhok (1990), Monthly Bulletins on Wholesale Price Indices
Translog cost function • The TL cost function is estimated as follows: C = g(Y1, Y2, PL, PF, PK, T) Where • C - total cost • Y1 freight output • Y2 passenger output • PL price of labor • PF price of fuel • PK price of capital
Translog Cost Function Ln C = α0 + αLlnPL + αKlnPK + αFlnPF + ½ αLL (lnPL)2 + αLKlnPL lnPK + αLF lnPL LnPF + ½ αKK (lnPK)2 + αKF lnPKlnPF + ½ αFF (lnPF)2 + β1lnY1 + β2lnY2 + ½ β11 (lnY1)2 + β12 lnY1 lnY2 + ½ β22 (lnY2)2 + γL1 LnY1lnPL + γK1 lnY1 lnPK + γF1 lnY1 lnPF + (β2λ) A + ½ (β22 λ2) A2 + (β12λ) A lnY1 + (β22 λ) A lnY2 + (γL2 λ) A ln PL + (γK2 λ) A ln PK + (γF2 λ) A ln PF
Explicit technology index is considered instead of a general indicator in terms of a trend variable • This has unique application for IR, which is characterized by technological advances largely on broad gauge track
Technology index - proportion of freight-ton kilometers carried by diesel and electric engines on broad gauge track to total freight-ton kilometers carried • The cost function is then modified as: C = G (Y1, Y2h (A), PL, PF, PK) Where ‘h’ is augmentation function such that for any given freight output, an increase in technology index A will result in decline in total costs
cross-section data for nine zones on Indian Railways: CR, ER, NER, NFR,NR,SCR, SER, SR, and WR • Three periods: Period 1:1981-82 to 1991-92; Period 2: 1992-93 to 2002-03; Combined period
Translog Estimates – First Order Coefficients • Of the 36 coefficients estimated seven are statistically significant in period 1, 16 in period 2 and 19 in combined period • Estimated cost function - non-decreasing in outputs at each observation in three periods (as output increases costs will also increase) • Estimated variable cost function is non-decreasing in labor in period 1, in capital in period 2 and in labor in combined period (one percent increase in price of capital increases cost by 1.18 % in 2nd period)
Second-Order Coefficients • In period 1, labor-labor, technology-labor and technology-capital are statistically significant • In period 2, interactions of labor-fuel, labor-capital and labor-labor, technology-freight output are statistically significant • In combined period, interactions of labor-labor, labor-fuel, technology-passenger output, freight output-labor, freight output-capital, passenger output-labor, passenger output-fuel, passenger-output capital, technology – passenger output, technology-labor, technology-capital are statistically significant
Translog Cost Function – Dummy Variables • In period 1, differential intercepts with SER as reference period are not statistically significant • In period 2, differential intercepts of ER, NER, NFR, SCR, SR and WR are statistically significant • In combined period, differential intercepts of NER, NFR, SCR and SR are statistically significant
Elasticity of Cost w.r.t. Technology • 1% increase in technology indicator at the mean resulted in a cost reduction of 3.5% - combined period • 1.8% - period 1 • Nearly 1% - period 2
Partial Elasticities of Substitution- Technology and Labor • One percent increase in technology is associated with 0.89 percent decline in labor in combined period • 0.14 percent in period 1 • 0.21 percent in period 2
Technology and Fuel • One percent increase in technology resulted in a decline fuel by 1.09 percent in period 1 • 0.11 percent in period 2 • 1.04 percent in combined period
Technology and Capital • One percent increase in technology - 2.8% increase in capital in period 1 • 0.67% in period 2 • 3.13% in combined period Nature of technical change is such that it reduced fuel and labor services and increased capital services