Download
1 / 21
210 likes | 233 Views
Explore Mini Stave thermal measurements, FEA simulations, and fluid temperature analysis with detailed outlines and comparisons for accurate results.

E N D
Mini-stave Thermal FEA update Shuaiyan 2019/05/28
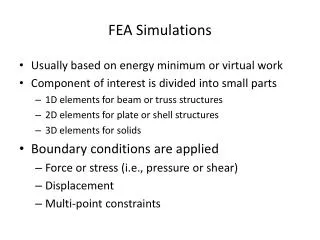
Outline • Mini stave measurement at T +21C with resistor powered • FEA comparison across stave, along PCB
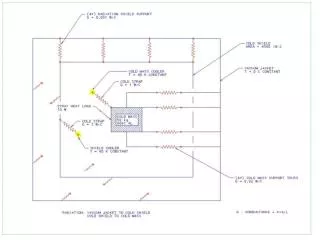
1. Mini stave thermal measurement at T +21C (05/23) Measurement set up remains same as 05/14 , chiller set T +20C • Measurement 05/23 • Cooling fluid flow rate: ~0.34L/min • Resistor power: LHSM, each ~0.9W, total seven resistors • Add box air flow • Bypass T: inlet 21.2, outlet 21.7C • Pixel length: ~0.62 mm • FEA simulation • Pipe T: linear increase along pipe • Ambient T: 21.8C • Ambient contact coefficient: W/mm2K • Cooling fluid contact coefficient: 0.003 W/mm2K @ T+20C • Ambient contact region: PCB & main stave surface, both sides
surface temperature comparison (05/23) X=220 X: pixel index Red: measured T at index x Green: x-1 Purple : x+1 Black : average Blue: FEA T X=250 Emissivity used for PCB: 0.92
X=290 X=340
X=360 X=400
surface temperature along PCB (05/23) Y=350 X=365
X=380 X=390
surface temperature along shell (05/23) X=160 X=180
X=240 X=280
PCB surface temperature comparison with two contact coefficients (05/14 measurement) FEA simulation: blue curve , ambient contact coefficient (5.5E-6) ; gray curve (8.5E-6) W/mm2K X=223 X: pixel index Red: measured T at index x Green: x-1 Purple : x+1 Black : average Blue: 5.5E-6 Gray: 8.5E-6 X=254 Emissivity used for PCB: 0.92
X=260 X=300
X=320 X=355
Main surface temperature comparison with two contact coefficients (05/14 measurement ) X=60 Blue: 5.5E-6 Gray: 8.5E-6 X=130
X=210 X=280
X=350 X=420
3. Fluid in/out temperature measurement A third thermal couple installed between two extension pipes’ ends Run chiller set T at -5, -15 and -20C Measure fluid temperature at by pass (T_in & T_out) and extension ends (T_mid) Fluid flow rate: ~1L/min Chiller start at room temperature Third thermal couple Flow direction
Fluid in/out temperature plot Temperature at equilibrium: T in -2.5 ~ -2.6C T mid -2.3 ~ -2.4C T out -2.1C Temperature at equilibrium: T in 20.8C T mid 20.7 ~ 20.8C T out 20.9C
Temperature at equilibrium: T in -11.8C T mid -11.5C T out -11.1C Temperature at equilibrium: T in -16.3C T mid -16C T out -15.6C
Back up: Thermal couple test form Will Heidorn (Dec 2018) From manufacture