Download
1 / 39
390 likes | 622 Views
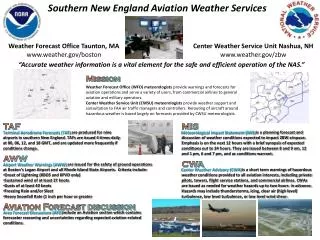
The 17 Feb 2006 Severe Weather and High Wind Event across Eastern New York and New England. Thomas A. Wasula and Neil A. Stuart NOAA/NWS at Albany Alicia C. Wasula SUNY/University at Albany Northeast Regional Workshop 8 November 1-2, 2006. Motivation.

E N D
The 17 Feb 2006 Severe Weather and High Wind Event across Eastern New York and New England Thomas A. Wasula and Neil A. Stuart NOAA/NWS at Albany Alicia C. Wasula SUNY/University at Albany Northeast Regional Workshop 8 November 1-2, 2006
Motivation • Cool season severe weather events are very uncommon in the Northeast (very few events in February) • To understand why the severe weather occurred in the morning of this case study and what caused the anomalous high wind event • To test the hypothesis that the line of severe convection was a Narrow Cold Frontal Rainband (Strongly Forced High Shear-Low Instability Convective Line)
Data • Thunderstorm Day data from NCDC • Observational surface and upper air data • Anomaly plots based on the NCEP/NCAR Global Reanalysis Dataset (1960-1990 21-day mean) • LAPS and MSAS Hourly data • NAM12 model data • Satellite/Water Vapor and Lightning data • KENX 8-bit radar data
Albany has only ~6 in over 60 yrs in FEB ! Albany Averages 24 T-storm Days/Year Data Source: NCDC
Background on 17 FEB 2006 Event • Severe weather ahead of cold front not well anticipated (High wind event was well anticipated) • 12+ severe weather events from bowing segments in narrow cold frontal rain band • Much of eastern New York in left front quadrant of mid- and upper-level jet streaks • Powerful shortwave trough and arctic front were lifting mechanisms
High Wind Event 2/17/06 • National Grid reported 100,000+ customers out of power in eastern New York. Saratoga and Warren Counties were hit especially hard (i.e. Saratoga Springs significant tree and utility pole damage) • Post-frontal wind gusts of 60 to 85 mph were common • Infamous gust to 143 mph atop Stratton mountain (3885 ft) in southern VT • Wind gusts and widespread damage similar to July 15,1995 and the Labor Day 1998 Derechoes
Mosaic Radar Loop 12Z-1930Z 17 FEB 2006 www.spc.noaa.gov
Severe Weather 17 February 2006 16 FEB reports 57 hail 40 wind 1 tornado www.spc.noaa.gov
1200Z 17 FEB 2006 Surface Map Albany Forecast Area in warm sector (Sfc temps~10°C and dewpoints ~5°C)
1200 UTC 17 FEB 2006 500 hPa Heights, Isotachs and Temps www.spc.noaa.gov
12Z 17 FEB 2006 Low Level Standardized Anomalies (vs. 1960-1990 climo.)
SPC Severe Weather Outlooks This event was extremely challenging on all levels !!! 1300Z 17 FEB 2006 1630Z 17 FEB 2006
Severe Weather Composite (700-500 mb lapse rates) Little SBCAPE to work with…but steep mid level lapse rates (based on RUC from SPC)
1200 UTC 17 FEB 2006Albany Sounding Unidirectional 300-850 hPa flow ***12Z BUF Sounding FROPA with MLCAPE < 50 J kg-1 and 0-6 km shear 89 kts***
1415Z Water Vapor Image Convective initiation occurs in clear slot behind pre-frontal trough
1445Z Visible Satellite Picture and 15 Min LTG Clearing ahead of cold front.
12Z NAM12 0-6 km Bulk Shear and 0-10 km MUCAPE for 15Z 17 FEB 2006 0-6 km Bulk Shear values 65-85 knots MUCAPE < 100 J kg-1
12Z NAM12 F1500Z Cross-section down the Hudson River Valley (Omega, Theta-e and Winds) White arrow indicates weak convective instability (theta-e decreasing with height)
16Z LAPS SBCAPE and Lifted Indices SBCAPE < 200 J kg-1
16Z MSAS 3-hr MSLP Change 3-hr pressure rises up to 14 hPa
Meteograms: 17/06Z-17/18Z G48 G40 G40 G52 G52 G44 G42 G42 TEMP (F) DWPT (F) PMSL SYR ALB
1320Z 0.5° KENX Reflectivity ALY Approaching developing line of convection with the cold front. Prefrontal trough showery activity helps moisten the boundary layer.
1400Z 0.5° KENX Reflectivity Convective line more organized… no lightning yet !
1453Z KENX Base Reflectivity Bow Echo develops and first warning issued at 1454Z.
1459Z 0.5° KENX REF and Velocity Significant BowEcho Shallow mesocyclone develops N/NE of RDA. Roof blown off home in Edinburgh with northern bow. Southern bow had 62kt gust. Saratoga County velocity values > 55 knots at 3.3-5.3kft AGL
1511Z Base Reflectivity and Velocity Washington County hit hard next with 55-65 kts AGL at 3.5-6.5kft. MESO base and top (5.1; 7.5kft)
1510Z Composite Reflectivity Cross-section (Penny Size Hail) 45 dBz to ~10kft!
1516Z KENX VIL and 15 min LTG VIL 15 kg m2
1534Z 0.5° KENX Reflectivity and Velocity Squall line passed east of ALY with winds 65-75kts 2-3kft AGL Winds 80-100 kts 3.5-5kft AGL. KDDH 57kt gust.
1545Z KENX Echo Tops ETs 15-20kft
Preliminary Results • Highly anomalous February severe weather event in Northeast US • 925/850 hPa wind anomalies of +/- 2-3 • Low CAPE/high shear environment • Convective initiation occurs in clear slot behind pre-frontal trough after PBL is moistened • Narrow cold-frontal rainband results from strongly forced linear convective line
Future Work • Frontogenesis calculations at surface, 925, 850 hPa • Develop climatology of cool season severe weather events in Northeast US to improve forecaster recognition 24+ hours in advance
Acknowledgements • John Quinlan (GIS Wind Damage slide) • Rich Grumm (Anomaly slides of the event) • Warren Snyder (WES upgrade and case download) • Robert Tracey (SUNYA undergrad) for his help with the radar loop