Download
1 / 34
340 likes | 385 Views
Typical Aligned Biological Sequence Data. MAX_mouse ADKRAHHNALERKRRDHIKDSFHSLRDSVPSLQG-EKASRAQILDKATEYIQYMRRKNHT DMAX_MOUSE ----------------------EQPRFQsa-------ASRAQILDKATEYIQYMRRKNHT MAX3_HUMAN ADKRAHHNALERKRRDHIKDSFHSLRDSVPSLQG-EKASRAQILDKATEYIQYMRRKNHT

E N D
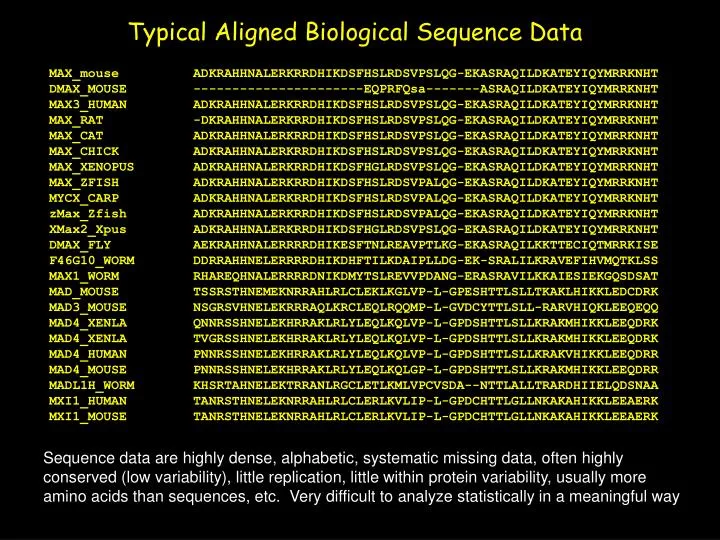
Typical Aligned Biological Sequence Data MAX_mouse ADKRAHHNALERKRRDHIKDSFHSLRDSVPSLQG-EKASRAQILDKATEYIQYMRRKNHT DMAX_MOUSE ----------------------EQPRFQsa-------ASRAQILDKATEYIQYMRRKNHT MAX3_HUMAN ADKRAHHNALERKRRDHIKDSFHSLRDSVPSLQG-EKASRAQILDKATEYIQYMRRKNHT MAX_RAT -DKRAHHNALERKRRDHIKDSFHSLRDSVPSLQG-EKASRAQILDKATEYIQYMRRKNHT MAX_CAT ADKRAHHNALERKRRDHIKDSFHSLRDSVPSLQG-EKASRAQILDKATEYIQYMRRKNHT MAX_CHICK ADKRAHHNALERKRRDHIKDSFHSLRDSVPSLQG-EKASRAQILDKATEYIQYMRRKNHT MAX_XENOPUS ADKRAHHNALERKRRDHIKDSFHGLRDSVPSLQG-EKASRAQILDKATEYIQYMRRKNHT MAX_ZFISH ADKRAHHNALERKRRDHIKDSFHSLRDSVPALQG-EKASRAQILDKATEYIQYMRRKNHT MYCX_CARP ADKRAHHNALERKRRDHIKDSFHSLRDSVPALQG-EKASRAQILDKATEYIQYMRRKNHT zMax_Zfish ADKRAHHNALERKRRDHIKDSFHSLRDSVPALQG-EKASRAQILDKATEYIQYMRRKNHT XMax2_Xpus ADKRAHHNALERKRRDHIKDSFHGLRDSVPSLQG-EKASRAQILDKATEYIQYMRRKNHT DMAX_FLY AEKRAHHNALERRRRDHIKESFTNLREAVPTLKG-EKASRAQILKKTTECIQTMRRKISE F46G10_WORM DDRRAHHNELERRRRDHIKDHFTILKDAIPLLDG-EK-SRALILKRAVEFIHVMQTKLSS MAX1_WORM RHAREQHNALERRRRDNIKDMYTSLREVVPDANG-ERASRAVILKKAIESIEKGQSDSAT MAD_MOUSE TSSRSTHNEMEKNRRAHLRLCLEKLKGLVP-L-GPESHTTLSLLTKAKLHIKKLEDCDRK MAD3_MOUSE NSGRSVHNELEKRRRAQLKRCLEQLRQQMP-L-GVDCYTTLSLL-RARVHIQKLEEQEQQ MAD4_XENLA QNNRSSHNELEKHRRAKLRLYLEQLKQLVP-L-GPDSHTTLSLLKRAKMHIKKLEEQDRK MAD4_XENLA TVGRSSHNELEKHRRAKLRLYLEQLKQLVP-L-GPDSHTTLSLLKRAKMHIKKLEEQDRK MAD4_HUMAN PNNRSSHNELEKHRRAKLRLYLEQLKQLVP-L-GPDSHTTLSLLKRAKVHIKKLEEQDRR MAD4_MOUSE PNNRSSHNELEKHRRAKLRLYLEQLKQLGP-L-GPDSHTTLSLLKRAKMHIKKLEEQDRR MADL1H_WORM KHSRTAHNELEKTRRANLRGCLETLKMLVPCVSDA--NTTLALLTRARDHIIELQDSNAA MXI1_HUMAN TANRSTHNELEKNRRAHLRLCLERLKVLIP-L-GPDCHTTLGLLNKAKAHIKKLEEAERK MXI1_MOUSE TANRSTHNELEKNRRAHLRLCLERLKVLIP-L-GPDCHTTLGLLNKAKAHIKKLEEAERK Sequence data are highly dense, alphabetic, systematic missing data, often highly conserved (low variability), little replication, little within protein variability, usually more amino acids than sequences, etc. Very difficult to analyze statistically in a meaningful way
A major goal of biological research is to provide general models or systematic principals to explain complex phenomena. In proteins, this involves the molecular architectureoftheir component parts their origins, regulation, interrelationships and evolution.
Computational Biology Holy Grail Sequence → Structure → Function → Evolution MDALQLANSAFAVDLFKQLCEKEPLGNVLFSPICLSTSLSLAQVGAKGDTANEIGQVLHFENVKDIPFGFQTVTSDVNKLSSFYSLKLIKRLYVDKSLNLSTEFISSTKRPYAKELETVDFKDKLEETKGQINNSIKDLTDGHFENILADNSVNDQTKILVVNAAYFVGKWMKKFPESETKECPFRLNKTDTKPVQMMNMEATFCMGNIDSINCKIIELPFQNKHLSMFILLPKDVEDESTGLEKIEKQLNSESLSQWTNPSTMANAKVKLSIPKFKVEKMIDPKACLENLGLKHIFSEDTSDFSGMSETKGVALSNVIHKVCLEITEDGGDSIEVPGARILQHKDELNADHPFIYIIRHNKTRNIIFFGKFCSP D D E O B Serine proteinase inhibition (Ovalbumin) E C B C O Interrelationships with other proteins – the “Network” Problem Evolution of the network
Are phylogenetic trees the best way to describe protein sequence variability and evolution?
Phylogenetic Trees: Pros • Trees are good for • describing hierarchical patterns • clustering taxa • describing extent of lineage divergence • estimating ancestral relationships • summarizing overall changes in data.
Phylogenetic Trees: cons • Trees are NOT very good for: • understanding dimensionality • analyzing covariation • describing the biological basis of evolutionary divergence • elucidating the components upon which selection might operate
Significance of Covariation • Understanding covariation is fundamental to modeling protein structure and evolution • Evolutionary and structural change constrained by covariation among amino acids • Accurate prediction of protein structure requires knowledge of covariance structure • Covariation reduces the dimensionality of phylogenetic information • Analytical procedures (like ML) make strong assumptions about covariances
Decomposition of Covariance Among Amino Acid sites i and j Cij = CP + CS + CF + CI + e Unexplainedeffects Phylogeneticconstraints Functionalconstraints Interactions between model components Structural constraints
Phylogeneticconstraints abCDeF abCDeF (Taxa related by a common evolutionary history) abcDeF AbCdeF abcDeF abcDef abcdef orthology Gene duplication (paralogy) aBCdeF aBCdEF ABcdeF ABcdeF aBcdeF ABcdeF evolutionary time
7 4 3 1 6 5 2 Proximityeffects Compensatoryinteractions Constraints dueto folding Structural constraints – associationsamong amino acids arise from the3-dimensional geometry or “folding” pattern of proteins.
Some Structural Associations in Proteins Hydrophobic interactions: associations among amino acids with non-polar side chains Salt bridges: correlations between charged residues Hydrogen bonds: correlations between electron donors and receptors Size constraints: correlations between large and small side chains
bHLH transcriptional regulators control a diverse array of developmental processes. Basic (B) region binds to hexanucleotide E-box and controls gene expression. Helix-loop-helix (HLH) region involved in protein – protein interactions (dimerization) At least 5 different DNA binding groups in bHLH proteins based on how basic region interacts with E-Box
bHLH – Leucine Zipper Structure Many bHLH proteins lack LZ
Generalized Covariance Matrix Amino acid sites i j k . n i Ei j Mij Ej k Mik Mjk Ek . . . . . n Min Mjn Mkn . En E reflects amino acid diversity at each site M describes mutual information between sites
Packed sites in Max defining hydrophobic core are in red Zhi Wang Entropy Dynamics in bHLH Domain 1.00 B-3 0.90 H2-63 H1-14 L-29 H1-21 H1-18 L-30 H2-62 B-4 B-7 0.80 H1-15 B-11 H1-25 L-45 H2-56 H2-59 H1-22 B-8 H1-26 L-46 H2-52 0.70 H2-51 H2-55 L-31 B-5 L-49 0.60 L-48 H1-16 B-1 B-6 H1-27 Normalized Entropy 0.50 B-13 B-10 H1-24 B-2 0.40 L-47 H1-20 H2-60 H2-64 H1-28 H2-57 0.30 H2-53 H2-61 B-9 H1-17 B-12 0.20 Packed sites in Max defining hydrophobic core are in red 0.10 H2-50 H2-54 H1-23 0.00 B-1 B-2 B-3 B-4 B-5 B-6 B-7 B-8 B-9 B-10 B-11 B-12 B-13 L-29 L-30 L-31 L-45 L-46 L-47 L-48 L-49 H1-16 H1-17 H1-18 H1-19 H1-20 H1-21 H1-22 H1-23 H1-24 H1-25 H1-26 H1-27 H1-28 H2-59 H2-60 H2-61 H2-62 H2-63 H2-64 H2-65 H2-66 H2-50 H2-58 H1-14 H1-15 H2-53 H2-54 H2-55 H2-56 H2-57 Amino Acids Dynamic pattern indicative of amphipathic α-helix with highly variable hydrophilic face alternating with conserved hydrophobic core. Spectral analysis confirms periodicity of ~3.6.
5' 5' 3' G5L C5L Arg 12A A4L T4L Ser 41B G3L C3L Glu 9A His 5A A2L T2L Lys 42B Glu 10B Arg 13B G1L Lys 6A C1L Arg 13A Lys 6B G1R C1R Glu 10A A2R T2R Glu 9B His 5B C3R G3R Lys 42B G4R C4R E-box Phosphates Ser 41A 3' Base pair recognitions G5R C5R Arg 15B Phosphate recognitions 5' From Shimizu et al. (1997) Amino acid composition defines DNA binding groups PHO4 - DNA Base Contacts Group B bHLH
Entropy Dynamics in bHLH Domain 1.00 B-3 0.90 H2-63 H1-14 L-29 H1-21 H1-18 L-30 H2-62 B-4 B-11 B-7 H1-15 0.80 H1-25 L-45 H2-56 H2-59 H1-22 B-8 H1-26 L-46 H2-52 0.70 H2-51 H2-55 L-31 B-5 L-49 L-48 0.60 B-1 H1-16 B-6 H1-27 Normalized Entropy 0.50 B-13 B-10 H1-24 0.40 B-2 L-47 H1-20 H2-60 H1-28 H2-64 H2-57 0.30 H2-53 H2-61 B-9 B-12 H1-17 0.20 Contacts phosphate backbone Contacts backbone in some groups Contacts base 0.10 H2-50 H2-54 Contacts both Packed sites in Max are underlined H1-23 0.00 B-1 B-2 B-3 B-4 B-5 B-6 B-7 B-8 B-9 B-10 B-11 B-12 B-13 L-29 L-30 L-31 L-45 L-46 L-47 L-48 L-49 H1-16 H1-17 H1-18 H1-19 H1-20 H1-21 H1-22 H1-23 H1-24 H1-25 H1-26 H1-27 H1-28 H2-59 H2-60 H2-61 H2-62 H2-63 H2-64 H2-65 H2-66 H2-50 H2-58 H1-14 H1-15 H2-53 H2-54 H2-55 H2-56 H2-57 Amino Acids
Max protein HLH x HLH interaction region
Factor Analysis of Mutual Information Matrix of Amino Acids • 64 amino acids of bHLH domain, 288 sequences • 64 x 64 matrix of standardized MI matrix elements • Maximum Likelihood factor analysis used • 7 factors extracted that accounted for all of the commoninformation • Multivariate patterns of amino acid covariation described and then related to known 3-D structure of bHLH domain from crystal structure studies
Factor Analysis of bHLH Domain Covariances • Analyses involving covariances among 49 amino acid sites in bHLH domain • 288 separate bHLH domain sequences • Normalized mutual information values used • Seven significanteigenvectors • Each reflected significant multivariate components of covariation • Each eigenvector represented important phylogenetic, structural and functional information Michael Buck
Factor analysis of MI matrix. patterns of covariation Compute E, MI matrix for sequence elements Multiple alignment of sequences Flow of Statistical Analyses Factor Analysis of 500 amino acidattributes. Compute factor scores Transform alphabetic amino acidcodes to numericalfactor scores. (5 datasets) Projectfactorcoefficients onto RasMol models. Interpret Compute R matrices.of each data set. Factor analysis oneach dataset Determine patterns of physiochemicalvariation withinproteins Model underlyingcauses of multidimensional protein variation Model underlyingcauses of multidimensional protein variation
Association matrix N x N Amino acid sites E1 M E2 12 M M E3 13 23 M M M En 1n 2n 3n “Mutual Information” Factor Analysis Eigen-Structure l l l I II III X X X Site1 1 I 1 II 1 III X X X Site2 2 I 2 II 2 III X X X Site3 3 I 3 II 3 III X X X Site4 n I n II n III Magnitude of coefficients for amino acid sites and number of factors estimates complexity and dimensions of phylogenetic information
Portion of Factor matrix of MI values for 64 amino acid sites of bHLH domain. Varimax rotation of ML factor solution. High coefficients on each vector shown in yellow.
Factor analyses describe: • Dimensionality of shared and unique • covariation • Major patterns of amino acid covariation among all major bHLH lineages • A model for structural and sequence evolution in bHLH • An understanding of the biological bases of simultaneous changes among amino acid sites
Factor 1 • Accounts for 72% of sequence common covariance in 288 proteins • 22 of 49 sites with factor coefficients > 0.4 • Most sites with high coefficients occur on exposed or hydrophilic face of helices • High correlation between factor coefficients and site by site entropy values, clade membership and loop length • Sequence variation reflected by Factor 1 has strong phylogenetic signal bHLH monomer DNA FactorCoefficients > 0.5 > 0.4 > 0.3 < 0.3
Showing the orientation of the side-chains of the amino acids on the hydrophilic surface and awayfrom DNA
A B C ? D E F G H Estimating phylogenetic signal in any amino acid? • Use dummy variables for classification codes • Estimate phylogenetic tree from well-aligned sequences • Define clades (monophyletic lineages) • Delimiting clades uses both biological and statistical information -- clade definition can be somewhat subjective • Assign dummy variable to all sequences in each clade • Covariance between given site and dummy variable measures phylogenetic signal • Prediction of clade membership by multivariate statistics used to define “sequence signatures” • “Group membership” approach useful for structural and functional variables also
Correlations of Factor Coefficients of Pair-wise Mutual Information Values with Extrinsic Variables Clade = monophyletic lineages of proteins with equivalent functions Group = DNA Binding Groups based upon E-Box binding patterns Loop-length = number of residues in the loop region separating helices 1 and 2 Comm = Communality from factor analysis; amount of variability at site explained by 7 factors Entropy = extent of uncertainty (variability) at each site in the bHLH sequence domain Critical correlation coefficient to reject Ho at P < 0.01 = 0.43
10% of sequence variability • Large factor coefficients for 8 sites: 6 from DNA binding region, 1 from each helix • B2, B6, B8, B10 and B12 involved in protein side-chain – phosphate backbone contacts. B9 also contacts DNA base • Site H1-20 buried site with many van der Waal contacts with Helix 2. H2-57 important structurally. • Sites important to maintain structural “geometry” • All sites with high coefficients occur at nadirs of entropy dynamics plots. Highly conserved but intrinsic variability covarys among these 8 sites • 7 of 8 sites components of “sequence signature” that identifies all bHLH proteins
Entropy Dynamics in bHLH Domain 1.00 B-3 H2-63 0.90 L-29 H1-14 L-30 H1-21 H1-18 B-4 H2-62 B-7 B-11 0.80 H1-15 L-45 H2-56 H2-59 H1-25 H1-22 B-8 H2-52 H1-26 L-46 0.70 H2-51 H2-55 B-5 L-49 L-31 0.60 L-48 H1-16 B-1 B-6 H1-27 Normalized Entropy 0.50 B-13 B-10 H1-24 B-2 0.40 L-47 H2-60 H1-20 H1-28 H2-64 0.30 H2-61 H2-57 H2-53 H1-17 B-9 B-12 0.20 High coefficients – Factor 1 0.10 H2-50 High coefficients – Factor 2 H2-54 Packed sites in Max are underlined H1-23 0.00 B-1 B-2 B-3 B-4 B-5 B-6 B-7 B-8 B-9 B-10 B-11 B-12 B-13 L-29 L-30 L-31 L-45 L-46 L-47 L-48 L-49 H1-16 H1-17 H1-18 H1-19 H1-20 H1-21 H1-22 H1-23 H1-24 H1-25 H1-26 H1-27 H1-28 H2-59 H2-60 H2-61 H2-62 H2-63 H2-64 H2-65 H2-66 H2-50 H2-58 H1-14 H1-15 H2-53 H2-54 H2-55 H2-56 H2-57 Amino Acids
8 sites with large factor coefficients • Sites involved with interrelationships between variable and conserved sites. Each site adjacent to highly conserved “packed” site. • Suggests role in compensatory variation • Potentially important to maintain geometry of hydrophobic core • Strong phylogenetic content.
Definition of the Loop Region • H1-28 – P in 75% of sequences, initiates loop • H1-27 – packs against H2-60, H2-61 • L-47 – stabilizes loop path back into groove • H2-60 – interaction with helix 1 (H1-27)
MyoD 3-D Structure DNA Binding Group - A
PHO4 MyoD SREBP Max Models of bHLH-DNA Structure • Structures available for 6 proteins • Good fit of all to canonical structure • Function ofbHLH domain well- understood • Simple domain structure • Phylogeny well-documented USF