Effective Data Representation Techniques
Learn to construct bar charts, pie charts, pictograms, and histograms for clear visualization. Understand which chart type suits your data best and communicate effectively with statistical graphs using Excel. Explore various chart styles and find the right one to convey your message accurately.

Effective Data Representation Techniques
E N D
Presentation Transcript
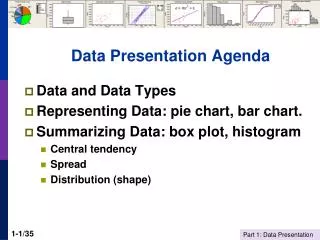
Objectives • Construct bar charts • Construct pie charts • Construct pictograms • Construct histograms • Have basis for choice of graph
Simple Bar Chart • Easy to understand • Useful for categorical data • Useful for reporting survey results • All bars same width • Length represents frequency Eye Colour
Stacked Bar Chart • For more complex situations • Contain more data • But may complicate the picture too much • Can be just stacked, or percentage • Percentage may be easier to understand
Pie Charts • Good for categorical data • Good for reporting survey results • Danger of misunderstanding or confusion if too many segments • Pull out a segment for emphasis • Easy to construct from Excel
More Pie Charts • Can go to 3D for effects • But may confuse audience • Can link 2 or more together Gender balance in Britain
Pictograms • Good at attracting attention • Make picture relevant to the topic • Can be misleading • Many different ways of presenting results
Pictograms (2) To show a doubling from last years production, this is last year If we double to volume of the picture If we double the height of the picture
Histograms • Key point that here it is the area which represents frequency • Term is often misused and a bar-chart has been drawn • Works for discrete data • Can go on to get frequency polygons • Link to development of statistical theory and probability density functions
Number of Children Number of Families 0 40 1 30 2 20 3 8 4 2 Histograms (2) Discrete data, so all bars are same width Some would not call this a histogram
Height Income Group Number of People 1 £5,000 but under £10,000 50 50 £10,000 but under £15,000 1 80 80 £15,000 but under £20,000 1 100 100 2 £20,000 but under £30,000 80 40 £30,000 but under £50,000 4 40 10 5 £50,000 but under £100,000 25 5 Histograms (3) With grouped data Pick a width as standard and relate others to it. Now divide frequency by relative width to get height
Histograms (4) Now plot using a linear scale on X-axis
Frequency Polygon By joining up the mid-points of the histogram blocks we get a frequency polygon This allows us to assess skewness in the distribution
Excel can quickly and easily construct statistical graphs Excel does not do histograms You have to decide which are appropriate Colour graphics may look good on screen, but often fail when printed out in black and white Using Excel
Conclusions • Statistical charts are about communication • When assessing a chart you need to ask if it succeeds in telling you what is going on. • There are few “right” answers in terms of which diagram to use, • but some may be viewed as “more appropriate” than others