Download
1 / 19
190 likes | 365 Views
Atomic Relaxation Models. A. Mantero, B. Mascialino, Maria Grazia Pia INFN Genova, Italy P. Nieminen ESA/ESTEC. Monte Carlo 2005 Chattanooga, 18-21 April 2005. http://www.ge.infn.it/geant4/lowE/index.html. Geant4 Low Energy Electromagnetic Physics.

E N D
Atomic Relaxation Models A. Mantero, B. Mascialino, Maria Grazia Pia INFN Genova, Italy P. Nieminen ESA/ESTEC Monte Carlo 2005 Chattanooga, 18-21 April 2005 http://www.ge.infn.it/geant4/lowE/index.html
Geant4 Low Energy Electromagnetic Physics • Geant4 provides a specialised package to handle electromagnetic interactions down to low energy • “Low” means up to 100 GeV Negative charged hadrons Positive charged hadrons and ions Electrons and photons Bethe-Bloch Models based on Livermore Library (EEDL, EPDL) Quantum Harmonic Oscillator high energy Ziegler/ICRU Parameterisations low energy (< 1 keV) down to 250 eV (lower in principle) ~ MeV region Penelope re-engineering + same as positive hadrons Free electron gas down to 100 eV low energy (down to ~ionisation potential)
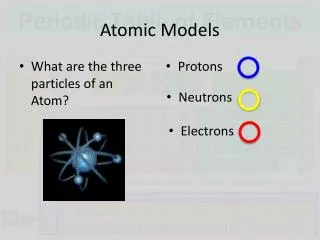
Precise process modeling Cross sections, angular distributions Charge dependence Relevant at low energies Take into account the atomic structure of matter Detailed description of atoms (shells) Secondary effects after the primary process De-excitation of the atom after the creation of a vacancy X-ray fluorescence Auger electron emission PIXE (Particle Induced X-ray Emission) Photon transmission, 1mm Pb shell effects Vision Atomic Relaxation following the creation of a vacancy by photoelectric effect, Compton effect and ionisation
Use case: fluorescence emission Original motivation from astrophysics requirements Cosmic rays, jovian electrons X-Ray Surveys ofAsteroids and Moons Solar X-rays, e, p Geant3.21 ITS3.0, EGS4 Courtesy SOHO EIT Geant4 Induced X-ray line emission: indicator of target composition (~100 mm surface layer) C, N, O line emissions included Wide field of applications beyond astrophysics Courtesy ESA Space Environment & Effects Analysis Section
Design Used by processes
Implementation Two steps: • Identification of the atomic shell where a vacancy is created by a primary process (photoelectric, Compton, ionisation), based on the calculation of cross sections at the shell level • Cross section modeling and calculation specific to each process • Generation of the de-excitation chain and its products • Common package, used by all vacancy-creating processes • Also used by Geant4 hadronic package, at the end of the nuclear de-excitation chain (e.g. radioactive decay)
X-ray fluorescence and Auger effect • Calculation of shell cross sections • Based on Livermore (EPDL) Library for photoelectric effect • Based on Livermore (EEDL) Library for electron ionisation • Based on Penelope model for Compton scattering • Detailed atom description and calculation of the energy of generated photons/electrons • Based on Livermore EADL Library • Production threshold as in all other Geant4 processes, no photon/electrons generated and local energy deposit if the transition predicts a particle below threshold
Test Plan Test Guidelines Test Automation Architecture Test Cases Test Data Test Results Test process • Unit, integration and system tests • Verification of direct physics results against established references • Comparison of simulation results to experimental data from test beams • Pure materials • Complex composite materials • Quantitative comparison of simulation/experimental distributions with rigorous statistical methods • Parametric and non-parametric analysis
K transition K transition Verification: X-ray fluorescence Comparison of monocromatic photon lines generated by Geant4 Atomic Relaxation w.r.t. reference tables (NIST) Transitions (Fe) Transition Probability Energy (eV) K L2 1.01391 -1 6349.85 K L3 1.98621 -1 6362.71 K M2 1.22111 -2 7015.36 K M3 2.40042 -2 7016.95 L2 M1 4.03768 -3 632.540 L2 M4 1.40199 -3 720.640 L3 M1 3.75953 -3 619.680 L3 M5 1.28521 -3 707.950
428.75, 429.75 eV (430 unresolved) 366.25 eV (367) 436.75, 437.75 eV (437 unresolved) Verification: Auger effect Auger electron lines from various materials w.r.t. published experimental results Precision: 0.74 % ± 0.07 Cu Auger spectrum
Pure material samples: • Cu • Fe • Al • Si • Ti • Stainless steel Test beam at Bessy - 1 Advanced Concepts and Science Payloads A. Owens, A. Peacock Monocromatic photon beam HpGe detector
Comparison with experimental data Photon energy Experimental data Simulation Parametric analysis: fit to a gaussian Compare experimental and simulated distributions Detector effects! (resolution, efficiency) % difference of photon energies Precision better than 1%
Si FCM beamline Si reference XRF chamber GaAs Test beam at Bessy - 2 Advanced Concepts and Science Payloads A. Owens, A. Peacock Complex geological materials Hawaiian basalt Icelandic basalt Anorthosite Dolerite Gabbro Hematite
Anderson Darling test A2 0.04 0.01 0.21 0.41 Beam Energy 4.9 6.5 8.2 9.5 Fluorescence spectrum of Icelandic Basalt 8.3 keV beam Ac (95%) = 0.752 Counts Energy (keV) Comparison with experimental data Pearson correlation analysis: r>0.93 p<0.0001 Effects of detector response function + presence of trace elements Experimental and simulated X-ray spectra are statistically compatibleat 95% C.L.
PIXE • Calculation of cross sections for shell ionisation induced by protons or ions • Two models available in Geant4: • Theoretical model by Grizsinsky – intrinsically inadequate • Data-driven model, based on evaluated data library by Paul & Sacher (compilation of experimental data complemented by calculations from EPCSSR model by Brandt & Lapicki) • Generation of X-ray spectrum based on EADL • Uses the common de-excitation package
Fit to Paul & Sacher data library; results of the fit are used to predict the value of a cross section at a given proton energy allow extrapolations to lower/higher E than data compilation First iteration, Geant4 6.2 (June 2004) The best fit is with three parametric functions for different groups of elements 6 ≤ Z ≤ 25 26 ≤ Z ≤ 65 66 ≤ Z ≤ 99 Second iteration, Geant4 7.0 (December 2004) Refined grouping of elements and parametric functions, to improve the model at low energies PIXE – Cross section model Next: protons, L shell ions, K shell
Regression deviation Residual deviation Total deviation Quality of the PIXE model • How good is the regression model adopted w.r.t. the data library? • Goodness of model verified with analysis of residuals and of regression deviation • Multiple regression index R2 • ANOVA • Fisher’s test • Results (from a set of elements covering the periodic table) • 1st version (Geant4 6.2): average R2 99.8 • 2nd version (Geant4 7.0): average R2 improved to 99.9 at low energies • p-value from test on the F statistics < 0.001 in all cases Test statistics Fisher distribution
Bepi Colombo Mission to Mercury Study of the elemental composition of Mercury by means of X-ray fluorescence and PIXE Insight into the formation of the Solar System (discrimination among various models)
Summary • Geant4 provides precise models for detailed processes at the level of atomic substructure (shells) • X-ray fluorescence, Auger electron emission and PIXE are accurately simulated • Rigorous test process and quantitative statistical analysis for software and physics validation • Beware:intrinsic precision of physics modeling and comparison with test beam results are two different aspects • both must be verified • Thanks to ESA for the support and collaboration to development and physics validation