Download
1 / 30
300 likes | 423 Views
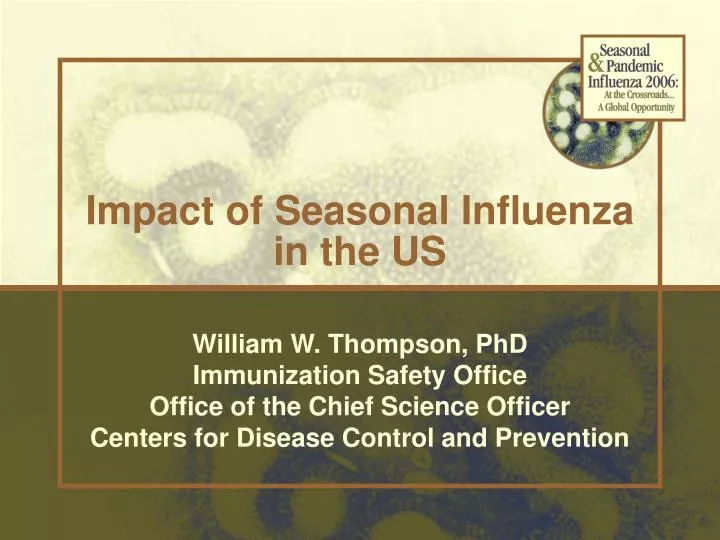
Impact of Seasonal Influenza in the US. William W. Thompson, PhD Immunization Safety Office Office of the Chief Science Officer Centers for Disease Control and Prevention. Collaborators. David Shay, CDC Influenza Branch Eric Weintraub, CDC, OCSO/ISO Lynnette Brammer, CDC Influenza Branch

E N D
Impact of Seasonal Influenza in the US William W. Thompson, PhD Immunization Safety Office Office of the Chief Science Officer Centers for Disease Control and Prevention
Collaborators • David Shay, CDC Influenza Branch • Eric Weintraub, CDC, OCSO/ISO • Lynnette Brammer, CDC Influenza Branch • Nancy Cox, CDC Influenza Branch • Joe Bresee, CDC Influenza Branch • Keiji Fukuda, WHO
Impact of Seasonal Influenza in the US • Describe variation in deaths in US • Seasonal Variation • Age Variation • Describe alternative models for estimating influenza-associated morbidity and mortality • Compare alternative model estimates • Review estimates of influenza impact • Deaths • Hospitalizations • Other morbidity
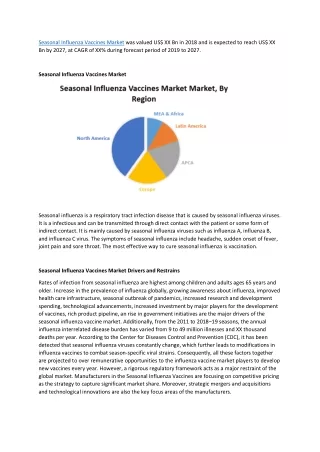
Seasonal Variation in Deaths • Currently, there are approximately 2.4 million deaths in the United States annually • 65,000 Underlying Pneumonia and Influenza deaths • No direct measure of impact of influenza • Strong seasonal component in US deaths • Peaks typically occur in December and January • Peaks tend to be associated with increases in influenza activity
70000 60000 50000 40000 Weekly All-Cause Deaths 30000 20000 10000 0 Jun-73 Jun-75 Jun-76 Jun-77 Jun-78 Jun-79 Jun-80 Jun-81 Jun-82 Jun-83 Jun-84 Jun-85 Jun-86 Jun-87 Jun-93 Jun-95 Jun-96 Jun-97 Jun-98 Jun-99 Jun-00 Jun-01 Jun-02 Jun-71 Jun-72 Jun-74 Jun-88 Jun-89 Jun-90 Jun-91 Jun-92 Jun-94 Year Seasonal Variation inAll-Cause Deaths (1972-2001)
Seasonal Variation in Underlying P&I Deaths (1972-2001) 5000 4000 3000 Weekly P&I Deaths 2000 1000 0 Jun-72 Jun-74 Jun-75 Jun-76 Jun-77 Jun-78 Jun-80 Jun-82 Jun-85 Jun-87 Jun-90 Jun-91 Jun-92 Jun-93 Jun-95 Jun-97 Jun-71 Jun-73 Jun-79 Jun-81 Jun-83 Jun-84 Jun-86 Jun-88 Jun-89 Jun-94 Jun-96 Jun-98 Jun-00 Jun-01 Jun-02 Jun-99 Year
250 225 200 175 150 125 100 75 50 25 0 Population Growth in Urban Areas of the US 1970-2000 Millions 1970 1980 1990 2000 Year
20.0 18.0 16.0 14.0 12.0 10.0 8.0 6.0 4.0 2.0 0.0 65-74 75-84 85+ Age Group 1970 2000 Population Growth in Numbersof Elderly in the US 1970-2000 Millions
1970 2003 Age Variation in Numbers of Deaths in the US 1970-2003 800,000 700,000 600,000 500,000 Deaths 400,000 300,000 200,000 100,000 - 0-4 Yrs 85+ Yrs 5-14 Yrs 15-24 Yrs 25-34 Yrs 35-44 Yrs 45-54 Yrs 55-64 Yrs 65-74 Yrs 75-84 Yrs Age Group
1970 2003 RR of All-Cause Death Versus Underlying P&I Death (NCHS 2000) 160 147 140 120 100 93 RR of Death due to All-Cause versus P&I 83 80 62 59 58 57 60 43 40 24 13 20 0 0-4 years 85+ years 5-14 years 15-24 years 25-34 years 35-44 years 45-54 years 55-64 years 65-74 years 75-84 years Age Group
Alternative Models for EstimatingImpact of Influenza in US • Simonsen et al. (1997) • Linear Regression Model • Modeled National Center for Health Statistics (NCHS) weekly death data from 1972-1992 • Outcomes • Underlying P&I Deaths (Most specific) • All-Cause Deaths (Least specific, most sensitive) • Model Yt = a + b*t +c*t2 + d*cos (2 t p/52) + f*sin(2 t p/52) + et
4000 3500 3000 2500 2000 1500 1000 500 0 Jul-89 Jul-90 Jul-91 Jul-92 Jul-93 Jul-94 Jul-95 Simonsen et al. 1997 Model P&I Deaths
Alternative Models for EstimatingImpact of Influenza in US • Thompson et al. (2003) • Poisson Regression Model • Modeled National Center for Health Statistics (NCHS) weekly death data from 1976-2000 • Incorporated WHO Influenza Surveillance Data • Outcomes • Underlying P&I Deaths (Most specific) • Underlying Respiratory & Circulatory Deaths • All-Cause Deaths (Least specific) • Model Yt = a exp (a + b*t +c*t2 + d*cos (2 t p/52) + f*sin(2 t p/52) + g * A(H1N1)% + h * A(H3N2)% + i * B%)
P&I Death Rate A(H3N2)% Circulation of A(H3N2) Viruses and Underlying P&I Deaths 110 60% 100 50% 90 80 40% 70 A(H3N2)% Positive 60 30% P&I Deaths Per 100,000 50 40 20% 30 20 10% 10 0 0% 1990 1991 1992 1993 1994 1995 1996 1997 1998 Year
Alternative Models for EstimatingImpact of Influenza in US • Barker & Mullooly (1980;1982) • Two Types of Baseline Rates • Peri-Season Baseline Rate • October through May when influenza is not circulating above 10% • Summer Season Baseline • June through September • Excess Rate = (Flu Rate) – (Non Flu Baseline Rate)
4000 Influenza Period Influenza Period 3000 Winter Baseline 2000 1000 Summer Baseline Summer Baseline 0 Jul-92 Jul-89 Jul-90 Jul-91 Jan-90 Jan-91 Jan-92 Mar-90 Mar-91 Mar-92 Sep-89 Nov-89 Sep-90 Nov-90 Sep-91 Nov-91 May-92 May-90 May-91 Seasonal Variation in Underlying P&I Deaths
Influenza-AssociatedAll-Cause Deaths by Modelin the US (1976-2000) 80,000 73,635 70,000 60,000 50,000 43,958 Annual Influenza-AssociatedDeaths in US 35,463 40,000 31,467 29,473 30,000 20,000 10,000 0 Simonsen 97 Simonsen 05 Peri Summer Poisson Alternative Models
Correlations Between Estimates of Influenza-Associated All-Cause DeathsIn the US (1976-2000)
120000 y = 1.3305x + 4744.5 R2 = 0.8729 100000 80000 60000 40000 20000 0 0 10000 20000 30000 40000 50000 60000 70000 Correlation Between Estimates forSimonsen 2005 and Peri-Season Models Peri Season Estimates Simonsen 2005 Estimates
Influenza-AssociatedUnderlying R&C Death Ratesby Age For Peri-Season Model 500 445.3 400 300 Deaths Per 100,000 200 165.9 85.5 100 46.8 26.0 8.7 2.4 0.4 0.4 0 <1 1 - 4 5 - 49 >= 85 50 - 64 65 - 69 70 - 74 75 - 79 80 - 84 Age Group
Influenza-Associated Underlying R&C Deaths by Age For Peri-Season Model 15,000 13,267 12,500 10,000 Influenza-Associated Deaths 7,500 6,220 5,017 5,000 3,651 2,945 2,457 2,500 719 92 52 - <1 1 - 4 5 - 49 >= 85 50 - 64 65 - 69 70 - 74 75 - 79 80 - 84 Age Group
Surveillance of Influenza-Associated Deaths Among Children in the US • 2003/2004 influenza season was severe compared to other recent seasons, especially among children • CDC implemented surveillance of childhood deaths associated with influenza • Reviewed case reports, medical records, autopsy reports
Surveillance of Influenza-Associated Deaths Among Children in the US • Results • 153 deaths among children aged < 18 years • 96 deaths among children aged < 5 years • 29% of the children died within 3 days of onset of the illness • 47% of the children had previously been healthy • CDC made influenza deaths among children a national reportable condition in October 2004
Influenza-AssociatedHospitalizations • Thompson et al (2004) • National Hospital Discharge Survey • Examined data from 1979-2001 • Incorporated WHO Influenza Surveillance data • Outcomes • Primary P&I (Most Specific) • Any Listed P&I • Primary R&C • Any-Listed R&C (Least Specific) • Model Yt = a exp (a + b*t +c*t2 + d*cos (2 t p/12) + f*sin(2 t p/12) + g * A(H1N1)% + h * A(H3N2)% + i * B%)
1400 1200 1000 800 600 400 200 0 < 5 Yrs 85+ Yrs 5-49 Yrs 50-64 Yrs 65-69 Yrs 70-74 Yrs 75-79 Yrs 80-84 Yrs Influenza-Associated Primary R&C Hospitalization RatesBy Age (1979-2001) Influenza-Associated Primary R&C Hospitalizations Per 100,000 Age Group
50,000 40,813 40,000 34,867 28,578 29,447 27,516 26,501 30,000 20,031 18,301 20,000 10,000 - < 5 Yrs 85+ Yrs 5-49 Yrs 50-64 Yrs 65-69 Yrs 70-74 Yrs 75-79 Yrs 80-84 Yrs Influenza-Associated Primary R&C HospitalizationsBy Age (1979-2001) Influenza-Associated Primary R&C Hospitalizations Age Group
Influenza-Associated HospitalizationsAmong Children Aged < 5 YearsBy Study 6.0 5.0 4.0 Hospitalizations Per 1,000Person Years 3.0 2.6 2.0 1.4 1.2 1.1 0.9 1.0 0.6 0.0 Barker(1982) Neuzil(2000) Izurieta(2000) Neuzil(2002) Thompson(2004) Iwane(2004) Study
800 700 600 500 400 300 200 100 0 0 - 4 5-14 15-44 45-64 65+ Low Risk High Risk Excess P&I Hospitalization RatesBy Risk StatusBarker & Mullooly (1980, 1982) Excess P&I Hospitalizations Per 100,000 Persons Age (Years)
Other Influenza-Associated Morbidity • Nichol et al (1999) LAIV Trial Aged 18-64 • Severe febrile illness • Work days missed • Doctors visits • Antibiotic use • Bridges at al (2000) TIV Trial Aged 18-64 • Febrile illness • Worked days missed • Doctors visits
Summary and Recommendations • Influenza infections are associated with substantial morbidity and mortality every year • Improve vaccine coverage for at-risk populations currently recommended for annual influenza vaccination by ACIP • The very elderly are at substantially increased risk for influenza-associated morbidity and mortality • Encourage development of vaccines with improved immunogenicity for older adults • The aging of the US population is leading to substantially more seasonal influenza-associated morbidity and mortality every year • Prepare public health officials for the increasing burden of disease associated with seasonal influenza over the next decade