Download
1 / 1
10 likes | 165 Views
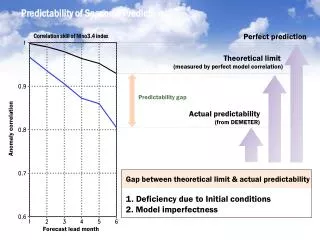
The impact of cloud water schemes on seasonal prediction. Akihiko Shimpo and Masao Kanamitsu. Experimental Climate Prediction Center (ECPC), Scripps Institution of Oceanography (SIO), UCSD, La Jolla, CA. ashimpo@ucsd.edu. Introduction

E N D
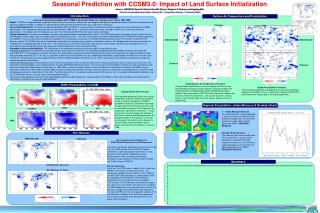
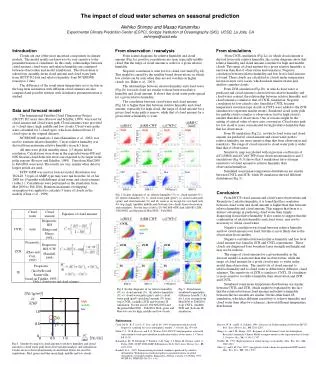
The impact of cloud water schemeson seasonal prediction Akihiko Shimpo and Masao Kanamitsu Experimental Climate Prediction Center (ECPC), Scripps Institution of Oceanography (SIO), UCSD, La Jolla, CA ashimpo@ucsd.edu Introduction Clouds are one of the most uncertain components in climate models. The model results are known to be very sensitive to the parameterization of cloudiness. In this study, relationships between cloud amount, cloud water and relative humidity are compared between observation and model simulations. The observation is taken from monthly mean cloud amount and cloud water path from ISCCP D2 data and relative humidity from NCEP/DOE reanalysis 2 data. The difference of the zonal mean temperature cross section in the long term simulation with different cloud schemes are also compared and possible relation with cloudiness parameterization is studied. From observation / reanalysis From scatter diagrams for relative humidity and cloud amount (Fig.1a), positive correlations are seen, especially middle cloud. But the range of cloud amount is wide for a given relative humidity. Negative correlation is seen for low cloud over land (Fig.1d). This might be caused by the satellite-based observations, in which low clouds can be seen when they are not overlain on higher clouds (ex. Hahn et al., 2001). The relationships between relative humidity and cloud water (Fig.1b) for each cloud are similar to those between relative humidity and cloud amount. It shows that cloud water paths spread for a given relative humidity. The correlation between cloud water and cloud amount (Fig.1d) is higher than that between relative humidity and cloud amount, especially for high cloud, the range of cloud amount for a given cloud water path is narrow, while that of cloud amount for a given relative humidity is wide. From simulations From CNTL simulation (Fig.2a), in which cloud amount is derived from only relative humidity, the scatter diagrams show that relative humidity and cloud amount correlate for high and middle clouds. The range of cloud amount for a given relative humidity is narrower than that of observation and reanalysis. Negative correlation between relative humidity and low level cloud amount is found. These clouds are calculated as clouds under temperature inversion layer over ocean, which include marine stratus and shallow cumulus clouds. From ZCR simulation (Fig.2b), in which cloud water is predicted and cloud amount is derived from relative humidity and cloud water content, the relationship between relative humidity and cloud amount is similar to that of CNTL simulation. Negative correlation for low cloud is also found like CNTL because temperature inversion type clouds in CNTL were added to the ZCR simulation to represent marine stratus. Simulated cloud water path for middle cloud is similar to observation, but for high cloud is smaller than that of observation. One of reasons might be the setting of critical value of snow auto conversion. Cloud water path for low cloud is more concentrated for high relative humidity than that for observation. From IS simulation (Fig.2c), in which cloud water and cloud amount are predicted, cloud amount and cloud water path to relative humidity are more sensitive than that from observation and reanalysis. The range of cloud amount to cloud water path is wider than that of observation. Sensitivity map was plotted with regression coefficients of d(C)/d(RH) and d(C)/d(CWP) from observation/reanalysis and 3 simulations (Fig.4). It shows that 3 simulations have stronger sensitivity of cloud amount to relative humidity than observation/reanalysis. Simulated zonal mean temperature distributions are similar between CNTL and ZCR, while IS simulation showed different distribution (Fig.3). Data and forecast model The International Satellite Cloud Climatology Project (ISCCP) D2 series data (Rossow and Schiffer, 1999) was used for cloud amount and cloud water path. Cloud amounts were provided as 3 cloud types, high, middle and low clouds. Cloud water paths were calculated for 3 cloud types, which are deduced from 15 cloud types in the original datasets. NCEP/DOE reanalysis 2 data (Kanamitsu et al., 2002) was used to estimate relative humidity. 3 layer relative humidity was derived from maximum relative humidity in each 3 layer. All data were global monthly mean, 2.5 degree lat/lon resolution. Calculations were done in the region between 60S and 60N because cloud detection errors are expected to be larger in the polar regions (Rossow and Schiffer, 1999). Data from Mar/2000 to Feb/2001 were used. The results are very similar when data for longer period are used. ECPC GSM was used as forecast model. Resolution was T62L28. 3 types of AMIP-type runs were run from the 1st of Jan 2000 for 15months with different cloud water and cloud schemes ( table.1 ). Calculations were performed on the simulation from Mar 2000 to Feb 2001. Random-maximum overlapping assumption was applied to calculate 3 types of clouds in the models (Chou et al., 1999). (d)RH-C (land) (a)RH-C (b)RH-CWP (c)CWP-C high high high high C [%] C [%] C [%] CWP [g/m2] middle middle middle middle C [%] C [%] C [%] CWP [g/m2] low low low low CWP [g/m2] C [%] C [%] C [%] RH[%] RH[%] CWP[g/m2] RH[%] Conclusion From ISCCP cloud amount and cloud water observations and Reanalysis-2 relative humidity, it is found that the correlation between cloud water and cloud amount is higher than that between relative humidity and cloud amount. This suggest that there is a distinct advantage in predicting cloud water than simply diagnosing from relative humidity. It also seems to suggest that the combination of relative humidity and cloud water may not be necessary to obtain cloud water. Negative correlation was found between relative humidity and low cloud amount over land, but this is most likely due to the observation from satellite. Negative correlation between relative humidity and low level cloud amount was found in ZCR and CNTL experiments. These clouds are diagnosed from boundary layer strength and height and may not be realistic. The range of cloud amount for a given humidity in the forecast models is narrower than that in observation, while the range of cloud amount for a given cloud water is wider in the model than observation. The sensitivity of cloud amount to relative humidity and to cloud water is different for different cloud schemes. The sensitivity of ZCR is similar to CNTL. IS cloudiness is more sensitive to relative humidity than observation and ZCR and CNTL. Simulated zonal mean temperature distributions are similar between CNTL and ZCR, which might be explained by the fact that the relation between cloud amount and relative humidity between the two models are similar. On the other hand, IS simulation, which has different sensitivity to relative humidity and cloud water than other two schemes, showed different temperature distribution. Fig.1 Scatter diagrams of (a) relative humidity (%) vs. cloud amount (%), (b) relative humidity (%) vs. cloud water path (g/m2), (c) cloud water path (g/m2) and cloud amount (%) and (d) same as (a) except for over land only. for (top) high, (middle) middle and (bottom) low clouds from observation and reanalysis. For the area (a)(b)(c) [0-360,60S-60N] and (d)[60E-120E, 30N-60N], and the period Mar/2000 – Feb/2001. (a)RH-C (b)RH-CWP (c)CWP-C CNTL CNTL high middle C [%] low ZCR ZCR ZCR ZCR C [%] C [%] CWP [g/m2] IS IS IS IS CWP [g/m2] C [%] C [%] Table.1 cloud water and cloud schemes RH[%] RH[%] CWP[g/m2] Fig.2 Scatter diagrams of (a) relative humidity (%) vs. cloud amount (%), (b) relative humidity (%) vs. cloud water path (g/m2) and (c) cloud water path (g/m2) and cloud amount (%) from (top) CNTL, (middle) ZCR and (bottom) IS simulation. For the area [0-360,60S-60N] and the period Mar/2000 – Feb/2001. Red, green and blue dots are for high, middle and low clouds. Fig.3 Zonal mean simulated temperature difference from R-2 (K) for 1 year average from Mar/2000 to Feb/2001. (top) CNTL, (middle) ZCR and (bottom) IS simulation. [(%)/(g/m2)] Z high middle low 1.0 C C C References Chou, M.-D., K.-T. Lee S.-C. Tsay, and Q. Fu, 1999: Parameterization for cloud longwave scattering for use in atmospheric models. J. Climate,12, 159-169. Hahn, C. J., W. B. Rossow, and S. G. Warren, 2001: ISCCP cloud properties associated with standard cloud types identified in individual surface observations. J. Climate,14, 11-28. Kanamitsu, M., W. Ebisuzaki, J. Woollen, S.-K. Yang, J. J. Hnilo, M. Fiorino, and G. L. Potter, 2002: NCEP-DOE AMIP-II Reanalysis (R-2). Bull. Amer. Meteor. Soc., 83, 1631-1643. Randall, D. A., 1995: Parameterizing fractional cloudiness produced by cumulus detrainment. Workshop on cloud microphysics parameterizations in global atmospheric circulation models, Kananaskis, Alberta, Canada, 23-25 May 1995, WCRP-90, WMO/TD-No.713, 1-16. Rossow, W. B., and R. A. Schiffer, 1999: Advances in Understanding clouds from ISCCP. Bull. Amer. Meteor. Soc., 80, 2261-2287. Slingo, A., and J. M. Slingo, 1991: Response of the National Center for Atmospheric Research Community Climate Model to improvements in the representation of clouds. J. Geophys. Res., 96, 15,341-15,357 Tiedtke, M., 1993: Representation of clouds in large-scale models. Mon. Wea. Rev., 121, 3040-3061. Zhao, Q., and F. H. Carr, 1997: A prognostic cloud scheme for operational NWP models. Mon. Wea. Rev., 125, 1931-1953. 0.5 Z I I I Z 0 0 0.5 1.0 [(%)/(%)] Fig.4 Sensitivity map for cloud amount to relative humidity and cloud amount to cloud water path from observation/reanalysis and simulations. Circles are for observation/reanalysis and initial letters are used for simulations. Red, green and blue mean high, middle and low clouds. RH[%] RH[%] CWP[g/m2]