Comparative Analysis of Multilane Roundabout Capacity: Case Study
320 likes | 339 Views
Explore types of circular intersections including traffic circles, rotaries, and modern roundabouts. Learn about their design, functions, and historical context. Case study analysis of a multilane roundabout in Alaska.

Comparative Analysis of Multilane Roundabout Capacity: Case Study
E N D
Presentation Transcript
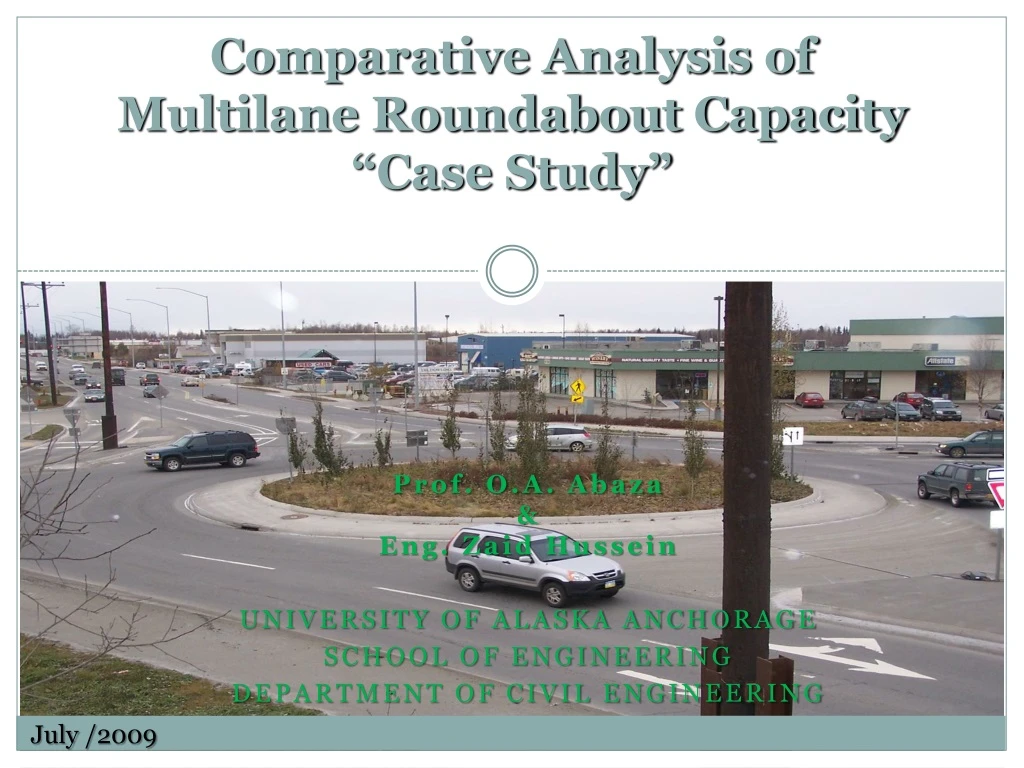
Comparative Analysis of Multilane Roundabout Capacity “Case Study” Prof. O.A. Abaza & Eng. Zaid Hussein University of Alaska Anchorage School of Engineering Department of Civil Engineering July /2009
Types of circular intersections The three most common types of circular intersections are: Rotary, Traffic Circle, Neighborhood Traffic Circle, Modern Roundabout.
Types of Circular Intersection Traffic Circles & Rotaries • 1900’s to 1940’s – many rotaries and traffic circles were built in the United States. The first traffic circle was built in 1905 “Columbus Circle in NYC”, • There was a lot of inconsistency in their design such as the, (design speed, who has the right-of-way (ROW), number of lanes, and the use of traffic signal). However the prevailing designs at that time were to: • enable high-speed, merging, and • give priority to entering vehicles to facilitate high speed entry • After the mid-1950’s –Rotaries and Traffic Circles fall out of favor in America . Due to their experiences to: • High crash experience • High traffic congestions • Circles locked up as traffic increase.
Types of Circular Intersection Traffic Circles • large diameter ≥ 300-ft, circulating speed ≥ 30mph , and often require motorist to move from one lane to another, • circulating traffic yield to entering traffic, • likely function as a circular confluence of streets, • may include a traffic signal within the circulatory roadway and/or approaching roadway, • may permit angle and parallel parking around the perimeter of the circle, and • pedestrians are likely encouraged to cross the central island at multiple location.
Traffic Circles Columbus Circle in NYC Source: lee Rodegerdts Source: lee Rodegerdts Source: lee Rodegerdts
Source Unknown Types of Circular Intersection Rotaries • rotaries are usually larger and serve a wider geographic function • large diameter ≥ 300-ft, circulating speed ≥ 30mph , and often require motorist to move from one lane to another, • circulating trafficyield to entering traffic, • traffic signals are not allowed, • some features may occupy the center island, and • Pedestrians are not allowed or not encouraged to cross the central island of the circular intersection. ROTARY http://www.iowadot.gov/roundabouts/roundabouts_design.htm
Neighborhood traffic circles Neighborhood Traffic Circles This type are generally located at the intersection of two local streets and are used for traffic calming and/or aesthetics. • diameter = 10’ – 40’ • circulating Speed <30mph • no Specific Role on Right of Way • approaches may be uncontrolled or stop-controlled • left turns may also occur in a clockwise direction in front of the center island at some traffic circles. Photography Source: Lee Rodegerdts Photography Source: Lee Rodegerdts
Types of circular intersections Roundabout or Modern Roundabout A roundabout is a type of circular intersection where traffic proceeds in a counterclockwise direction around a center island. This circular intersection can be used in place of standard stop-sign or signal-controlled intersections. Modern roundabout has the following distinguishing characteristics: diameter 80’ – 200’, circulating speed < 25mph, circular in shape, yield control for entering traffic, and geometric feature to slow traffic entering the roundabout (Deflection). channelized approaches (splitter island) pedestrians crossing goes around the roundabout.
Types of modern Roundabout The modern roundabout can be categorized based on type of environment ( Urban or Rural), size, and number of lanes. Urban setting • Mini-roundabout • Compact • Single-Lane • Double-Lane Rural Setting • Single Lane • Double Lane Source: Federal Highway Administration (FHWA)
Why Build Modern Roundabout reduce conflict points, that would likely reduce accidents rate, the severity of accident, However, the accident rate varies based on the existing conditions, driver experiences…etc calming devices, reduce traffic delay, best fit for light to medium traffic, and relative to rotary intersections, roundabout better suites heavy traffic.
Case Study: Overview Map. The Alaska Department of Transportation and Public Facilities (DOT&PF) 2007 Central Region Annual Traffic Report, classifies the E. Dowling Rd. from Lake Otis Pkwy to Old Seward Hwy as a minor arterial. This segment supports an Average Annual Daily Traffic (AADT) of 17,229 vehicles per day (vpd). This important arterial highway intersects with New Seward Hwy, which is a principle arterial by a multilane roundabout at grade-separated level.
Problem Statement. During the P.M. Peak hour, a queuing creation has been continuously observed on the roundabout located on the west side of the intersection. This queuing during limited time within the peak hour period extends to the adjacent intersection of Old Seward Hwy/E. Dowling Rd. A hypothesis was made in which this queuing causes a delay for the road users to get to their destination, more over that will cause environmental and economical problems, and might create a queue on the highway.
Capacity of Roundabout: • Its defined as the maximum flow rate that can be accommodated at a roundabout entry. It depends on • the circulating flow that make a conflicts with entry flow, • the geometric elements of the roundabout, and • the drivers behavior. • It is measured in term of average control delay, degree of saturation, capacity of an approach, 95th percentile queue length, all of these terms to be converted finally to level of service (LOS).
Methodology. The Federal Highway Administration Method (FHWA) Three performance measures are typically used to estimate the performance of roundabout: degree of saturation, delay, and queue length. • Maximum flow rate that can be accommodated at the roundabout entry. This depends on the circulating conflicting flow with the entering flow, and the geometric elements of the roundabout. • Degree of saturation, which is defined as the ratio of the demand to the capacity of an entry. In accordance with the FHWA methodology roundabout should operate at no more than 85 percent of its capacity. • Control Delay, which is the time that a driver spends queuing and then waiting for an acceptable gap (critical gap) within the circulating flow (conflicting flow) while at the front of the queue.
Methodology. The Transportation Research Board (TRB, Draft report 2006), and National Cooperative Highway Research Program Methods (NCHRP, report 572) • the roundabout capacity is determined based on the capacity of the critical lane on the critical approach, and • average control delay, and the 95th percentile queue. Both TRB and NCHRP multilane capacity models have exact same parameters as illustrated in Equation below that can be calibrated: The coefficient in front of the exponential term is equivalent to the follow-up time (tf) and the coefficient within the exponential term is equivalent to the tf and critical gap time (tc). • Where • Ccrit = entry capacity (pcu/h/lane) • A = 3600/tf • B = (tc – tf/2)/2600 • Vc = conflicting flow (pcu/hr) • tf = follow-up headway (s) • tc = critical headway (s)
TRB & NCHRP The two coefficient A and B shown in Equation 1 are based on model given in the (TRB draft report, 2006), which reflects observations made at U.S. roundabouts in 2003. The two coefficients A and B shown in Equation 2 are based on the model given in the NCHRP report 572, which is based on comprehensive inventory of U.S. roundabouts under NCHRP project (3-65).
FHWA, TRB, and NCHRP 95th Percentile Average Control Delay which is the time that a driver spends queuing and then waiting for an acceptable gap (critical gap) within the circulating flow (conflicting flow) while at the front of the queue. For the case study it was expected that the geometrical delay will be non-significant compared to the average control delay during the peak hour due to the limited adequate gaps that a driver may accept.
FHWA, TRB, and NCHRP Queue Length
Data Required For Evaluation Of An Existing Roundabout: Traffic Data entry traffic flow (down stream traffic), at the yield line, approaching traffic (up-stream traffic), circulating traffic flow, exiting traffic flow, Spot Speed Data spot speed study for the free movements during the off peak hours, and Existing Geometry Conditions measurements are needed for the study roundabout to calibrate the capacity analysis model, inscribes diameter, entry angle.
Traffic Counters Location The tubes were placed further than the yield sign and orientated perpendicular to the direction of traffic to ensure that both tires hit the tube at the same time. Vehicle hit the tube in an angle or slowly cross the tube might result in counting each vehicle twice or not counting that vehicle at all.
Spot Speed Study Locations Spot speed data were collected using a radar gun, recording speeds of free flow vehicles (i.e. vehicles not influenced by conflicting traffic or vehicles not part of a queue or a platoon) on each approach to the nearest 1 mph.
Data Analysis-FHWA The capacity of roundabout in general is based simplified regression relationship. The figure below shows the expected capacity of a double-lane roundabouts with inscribed diameters of (150 – 200 ft) based on the design template of the urban double-lane roundabout. W/O Calibration Qe = 2424 – 0.7159 QC = 2424 – 0.7159 * 997 = 1710 veh/hr 1710 Qe = 1939 – 0.6288 * 997 = 1312 veh/hr 997 W/ Calibration
Data Analysis-NCHRP & TRB The TRB model resulted in a lane capacity of 501/veh/hr, resulting in a total capacity of 1002 veh/hr for the eastbound approach. The NCHRP model resulted in a lane capacity of 562 veh/hr, resulting in a total capacity of 1124 veh/hr for the eastbound approach.
Results Comparison Overall, both the TRB, NCHRP methods yield a much lower LOS during the peak hour compared to FHWA method. That is because both the TRB, NCHRP methods consider the gap acceptance theory in their analysis, while, the (FHWA) method considers only the geometric design elements of the roundabout. 85% is the limit based on the FHWA
Speed Analysis On a typical roundabout all approaches should have an equal priority in order to provide equal adequate gaps for all approaches. From the spot speed analysis and field observation it was perceived that when drivers exit from the east roundabout and enter the west roundabout and vice versa, tends to prioritize themselves over other driver waiting on the approaches. This results in creating imbalanced queues on the other approaches.
Conclusion Based on the analysis contained herein, the East Dowling roundabout is operating near or over its capacity with a degree of saturation of 97%, 109%, and 83% and with LOS F, F, and C by using the NCHRP, TRB and FHWA methods, respectively However, from the site observation it was observed that a long queue start to form for about 10 to 20 min during the P.M. Peak hour after that queues start to demolish. That is considered an acceptable performance since the queues creations occurs and demolish in a short period of time. Both the TRB and NCHRP apply the gap acceptance theory, this results in a lower capacity. While the FHWA method results in a higher capacity reflecting the geometry conditions.
Recommendation Considering the short term (opening of East and West Dowling Road sections) and future (Long term) traffic growth or traffic patterns changes due to the committed projects within the Anchorage Bowl such as Highway-to-Highway (H2H) project the current operational performance may worsen. There are some recommendations were concluded from this study to improve the performance of the East Dowling roundabout considering future traffic such as: • Regulating vehicle’s speed exiting from one and entering the other roundabout that can be achieved by installing raised crosswalk.
Recommendation • Increasing the length of the right-turn bypass storage lane and installing acceleration lane that will likely reduce the queue length for traffic entering the roundabout. The use of acceleration lane will increase the merging speed, reduce the merging angle, theoretically the capacity of the exit non-yielding bypass lane will improve to LOS A. • Further study about the actual delay that drivers experience at roundabout is recommended to verify the calculated delay from the available methods.
What to Look For in Future Research • Further research to calibrate either the TRB or the NCHRP models is recommended to provide a model that reflects the Alaskan driver’s behavior. • Further study about the relationships between roundabout geometrical elements, circulating speed, and entering speed and their effect on its performance is recommended. Theoretically, the lower the circulating speeds the more the gaps would be available to the drivers waiting to be served. However, using SimTraffic software it was observed that a circulating speed, ranging from 15 to 25mph would reduce the fuel consumption. • Further study about the actual delay that drivers experience at roundabout is recommended to verify the calculated delay from the available methods.
Schematic Diagram of Possible Camera Locations For Capturing Critical Gap and Follow-up Time POISTION 1 (CRITICAL-TIME-GAP) POISTION 1 (FOLLOW-UP-TIME)


