Download
1 / 18
180 likes | 337 Views
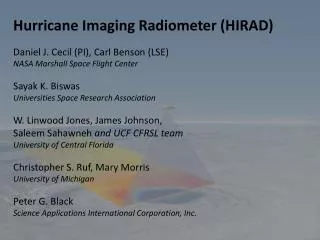
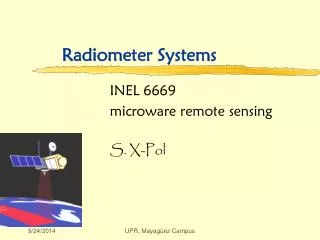
HIRAD Hurricane Imaging Radiometer. PI: Dan Cecil, NASA MSFC HIRAD Team (apologies to anyone I missed!): MSFC : Cecil, Mark James, Brent Roberts, Sayak Biswas (NPP), Tim Miller (retired) UAH : Dave Simmons, Lori Schultz

E N D
HIRADHurricane Imaging Radiometer PI: Dan Cecil, NASA MSFC HIRAD Team (apologies to anyone I missed!): MSFC: Cecil, Mark James, Brent Roberts, SayakBiswas (NPP), Tim Miller (retired) UAH: Dave Simmons, Lori Schultz UCF: Linwood Jones, Jim Johnson, SaleemSahawneh, Zoubair Ghazi, Ruiyao Chen, Spencer Farrar UMich: Chris Ruf, Mary Morris NRL: Pete Black AOML: Robert Atlas, Eric Uhlhorn HS3 Science Team Meeting, May 2013
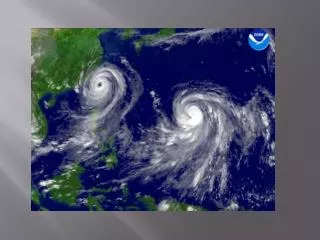
Hurricane Imaging Radiometer (HIRAD) • A passive microwave radiometer (C-band, 4 frequencies), similar to SFMR: Measures emissivity and retrieves hurricane surface wind speeds and rain rates over a wide-swath: • Swath Width ~ 60-80 km • Resolution ~ 1- 5 km • Wind speed ~10 – 85 m/s • Rain rate ~ 5 – 100 mm/hr • Synthetic Thinned Array Radiometer (not mechanically scanning) sees a wide swath below the aircraft • Flight History: • Hurricane Earl (2010 GRIP, WB-57) • Hurricane Karl (2010 GRIP, WB-57) • HS3 2012 Pacific Flight (AV-1)
Principles of Operation • HIRAD measures ‘emissivity’ over a range of incidence angles, emitted from ocean surface foam coverage (a function of wind speed) and intervening rain. • At the C-band microwave frequencies used (4-7 GHz), wind-driven foam coverage is invariant with frequency, while at the same time rainfall emissivity is a strong function of frequency. • These physical characteristics allow two geophysical variables (wind speed and rain rate) to be derived from emissivity measurements at 4-6 discrete C-band frequencies, which is an ‘over-determined’, ‘least-squares’ problem solvable with conventional mathematical techniques. • Surface wind speed and rain rate retrievals are derived from the correlation of HIRAD measured emissivity at operating incidence angles with modeled values. At nadir, these relationships have been validated via SFMR with co-located GPS dropsonde surface wind observations.
4 C-band Channelsto constrain geophysical parameters wind speed, rain rate, SST (SST can have an assumed value) • 4 GHz • 5 GHz • 6 GHz • 6.6 GHz • 4 GHz channel noisy on Global Hawk in 2012 • Could not reproduce noise in lab • Will test for interference sources at integration in July 2013
APC Slope Coefficients: 4 GHz No Good Subbands for 4 GHz! They should look similar to one of the 5 GHz patterns, below: SayakBiswas investigated so many ideas to try to find a source for the 4 GHz noise in 2012 Global Hawk flights, it started to frighten his family…
HS3 2012 Pacific Flight 5 GHz 6 GHz 6.6 GHz
Observed TB Leg #1 - 4 6.6 GHz 5 GHz 6 GHz Observed TB has incidence – angle dependence (related primarily to polarization) Retrievals use excess TB, after subtracting a background value that accounts for this dependence
0850Z 0923Z 1010Z 1123Z 1205Z OSCAT 06 Nov 12Z 30 kt- solid 40 kt dashed
Excess TB relative to RT model 6.6 GHz 5 GHz 6 GHz Observed TB has incidence – angle dependence (related primarily to polarization) Retrievals use excess TB, after subtracting a background value that accounts (somewhat) for this dependence. The above figures do not yet account for H-V polarization mixing, which is significant near edge of swath.
Excess TB relative to observed minimum 6.6 GHz 5 GHz 6 GHz Observed TB has incidence – angle dependence (related primarily to polarization) Retrievals use excess TB, after subtracting a background value that accounts (somewhat) for this dependence
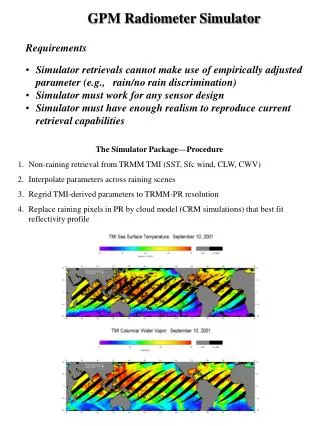
First HS3 2012 retrievals – subject to revision! Rain Rate Wind Speed 25 m/s 20 >30 m/s, but likely rain contamination 15 10 Rain rate retrieval (right) looks unrealistic, resulting in too much of the signal being attributed to wind (left) in some places. The pattern looks right, just not the magnitude. Having a “clean” 4 GHz channel and better-characterized thermal system (therefore better calibration) should help with future flights. My daughter vehemently objects to these retrievals
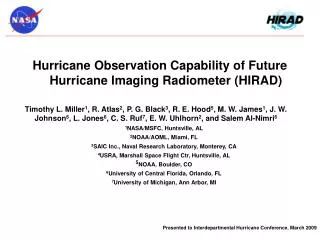
Hurricane Earl (GRIP 2010) HIRAD & SFMR Simultaneous WS Comparisons -Leg-4 SFMR swath HIRAD swath HIRAD WS, m/s X SFMR WS HIRAD WS These are single-channel (5 GHz) HIRAD retrievals, so eyewall rain column contaminates retrieval inside eye near swath edge HIRAD swath west-to-east, compared with south-to-north SFMR trace (34 minute time difference)
HIRAD Rain Rate Retrievals compared to SFMR -Leg-4 SFMR swath HIRAD swath HIRAD RR, mm/hr X HIRAD RR SFMR RR These are single-channel (5 GHz) HIRAD retrievals, so eyewall rain column contaminates retrieval inside eye near swath edge HIRAD swath west-to-east, compared with south-to-north SFMR trace (34 minute time difference)
HIRad Wind Speed Retrievals for Earl: 4 Legs Leg 4 Leg 6 Leg 1 Leg 3 m/s m/s
HIRad Rain Rate Retrieval for Earl: 4 Legs Leg 4 Rain rate, mm/hr Leg 6 Leg 3 Leg 1 mm/hr
Hurricane Karl (2010 GRIP) P3 radar reflectivity (left) HIRAD excess Tb 5 GHz (right) B-57F track Good feature agreement between WP-3D LF radar composite (left) and HIRADexcess brightness temperature (TB) composite (right) P3 radar center crossings WB-57 HIRAD center crossings at 19:16:49, 19:52:37, 20:33:44
HIRAD data status • HS3 2012 (Pacific Flight) HIRAD brightness temperatures are stable (except 4 GHz) during the legs over disturbed weather, have some drift during transits • Not a good case for HIRAD, between being an unsuitable target and having unexplained noise in 4 GHz • Can put brightness temperatures and low-confidence geophysical retrievals on servers, if desired • H. Earl (2010) from GRIP is the best case for HIRAD. Retrievals have not been sent to public servers / archive, but they can be sent. Current retrievals are empirical (from UCF); expect to transition to radiative-transfer based retrievals in June
HIRAD instrument status • Housekeeping board repaired and replaced • Thermal system modeling underway, to better control and characterize receiver temperatures during flight • Thermal chamber testing in late May – test effectiveness of new heater set-points • Test for interference sources after integrating on AV-1 in July • No obstacles to flight; these actions are all to improve data quality • For best calibration, we need a well-characterized clear, calm ocean scene at some point in a flight. “Clear, calm ocean” is the more important factor there – a buoy is helpful but not necessary. • A sequence of 360° turns (CW and CCW) at constant bank angle (~10-20°) over clear, calm ocean > 500 km from land would help calibration. Maneuvering every flight would be ideal, but two flights sufficient.