Download
1 / 34
340 likes | 368 Views
Explore the crucial role of the upper ocean in hurricane intensity changes using data acquired from Isidore and Lili hurricanes in the Gulf of Mexico. Improve predictive models by examining ocean heat content and vertical mixing processes.

E N D
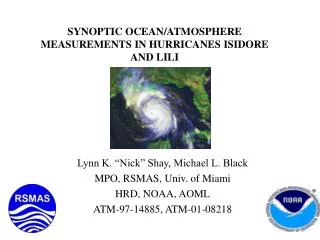
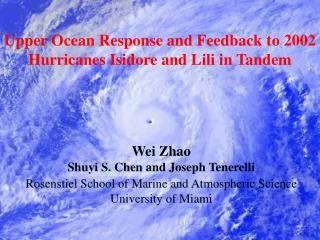
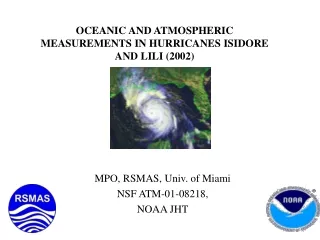
OCEANIC AND ATMOSPHERIC MEASUREMENTS IN HURRICANES ISIDORE AND LILI (2002) MPO, RSMAS, Univ. of Miami NSF ATM-01-08218, NOAA JHT
Acknowledgments: • Capt. Bob Maxson and Dr. Jim McFadden (AOC) and the entire staff (pilots, engineers, technicians). • Dr. Frank Marks (NOAA-HRD) for his continued support and HRD staff. • Dr. Steve Nelson (NSF-Dynamic Mesoscale Meteorology Program) for his continued support. • Dr. Russell Elsberry and the USWRP for recognizing the importance of the upper ocean on TC intensity issues. • Mr. Tom Cook and Dr. S. Daniel Jacob (UMBC) • Mr. Eric Uhlhorn, Cmdr. Sean White, Mr. Scott Guhin, Mr. Mike McGauley, Mr. Mike Black, and Mr. Robbie Berg.
Introduction: Long-term goal of the research is to understand the role of the upper ocean on hurricane intensity changes. Oceanic Heat Content (based on seasonal climatology and radar altimetry) improves predictive intensity models (i.e. SHIPS)-now part of the operational data stream (DeMaria et al. 2002, 2004; Mainelli et al. 2002; Mainelli and Shay 2004). Not the full story-OHC is modulated by vertical mixing processes through vertical current shear. Since 84, Only 6 Storms where Vertical Current Shear has been measured from AXCPs. Overview of Isidore and Lili data set acquired from AXCPs and AXCTDs and the GPS sondes prior, during and subsequent to their passage in the Gulf of Mexico. Relevant to modeling here at NCEP.
Challenge: Getting the current and shear correct in models for mixing.
2002 Summary: Isidore and Lili GPS/AXBT/AXCP/AXCTDs From 42/43
Hurricane Isidore Pre-Storm, Storm, Post-Storm:AXCP/AXCTD/AXBTs
SST (left panels) and OHC (right panels) for Pre-Isidore (upper) and Post-Isiidore (lower) Relative to Storm Intensity. (SSTs processed by RSMAS Remote Sensing Laboratory).
Hurricane Lili Pre-Storm, Storm, Post-Storm:AXCP/AXCTD/AXBTs
SST (left panels) and OHC (right panels) for Pre-Lili (upper) and Post-Lili (lower) Relative to Storm Intensity. (SSTs processed by RSMAS Remote Sensing Laboratory).
GPS sondes During the Lili’s Relative to Intensity and Track. G-IV (Left panel), P-3 (Right panels)
Ocean Profiles From EPAC, GOM, and LC based on AXCTDs.
Comparison of Mixing Schemes in HYCOM During the Passage of Gilbert.
HYCOM North Atlantic HYCOM at 0.08° resolution extending from 28° S to 70° N. 26 levels/ layers in the vertical. High resolution surface forcing from FNMOC with Salinity relaxation at the surface. 3° buffer zones in the north and south relaxed to climatology. Satellite altimeter surface height anomalies from the MODAS operational system at NAVOCEANO (Initial Fields Are Important!). Mean Sea Surface Height from the 0.08° Atlantic MICOM. Vertical projection of surface height signature using the Cooper-Haines (1996) technique. Sea Surface Temperature not assimilated at present.
Summary: Best Ocean-Atmosphere Data Set Ever Acquired During TC Passage! Successful set of experiments due to the teamwork between NSF and NOAA-unique opportunity during a rapid deepening cycle. Vertical current shear modulates SST/OHC variability and heat fluxes, and must be measured more frequently (T(z) is NOT enough). Improve satellite algorithms for OHC/SHIPS Forecasting of TC and Oceanic component of models at Operational Centers (NCEP). Data set will contribute to several MS/PhD studies (Uhlhorn, White, Guhin, McGauley).