Download
1 / 74
740 likes | 855 Views
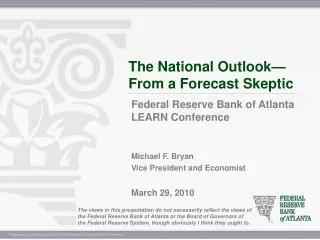
The National Outlook—From a Forecast Skeptic. Federal Reserve Bank of Atlanta LEARN Conference Michael F. Bryan Vice President and Economist March 29, 2010.

E N D
The National Outlook—From a Forecast Skeptic Federal Reserve Bank of Atlanta LEARN Conference Michael F. Bryan Vice President and Economist March 29, 2010 The views in this presentation do not necessarily reflect the views of the Federal Reserve Bank of Atlanta or the Board of Governors of the Federal Reserve System, though obviously I think they ought to.
GROWTH IN THE FOURTH QUARTER WAS QUITE STRONG—PUSHED HIGHER PRIMARILY FROM A LEVELING OFF OF INVENTORY REDUCTIONS. Blue Chip GDP Forecast Annualized quarterly percent change Actual Slowing in inventory liquidation SOURCES: Blue Chip panel of economists, March 10, 2010. 2
INVENTORIES APPEAR TO BE APPROACHING “NORMAL” LEVELS RELATIVE TO CURRENT SALES—A POSITIVE SIGN FOR NEAR-TERM GROWTH?
HOWEVER, RETAIL INVENTORIES SEEM UNUSUALLY LEAN, WHILE MANUFACTURING STOCKS ARE STILL ELEVATED.
REAL FINAL SALES (GDP LESS INVENTORIES) HAS SHOWED MUCH MORE MODEST GROWTH. SPENDING IN THE U.S. ACTUALLY MODERATED LAST QUARTER. 5
MODERATE GROWTH IS ANTICIPATED THIS QUARTER AS THE IMPETUS OF FISCAL POLICY WANES Blue Chip GDP Forecast Annualized quarterly percent change Actual 8
THE 2010-11 ECONOMIC FORECAST The Fortune Teller (De La Tour)
THE 2010-11 ECONOMIC FORECAST The Fortune Teller (De La Tour)
YEAR-AHEAD CONSENSUS GDP FORECAST Annual Growth Rate predicted 07 04 02 03 06 05 97 00 01 96 98 99 94 95 92 93
YEAR-AHEAD CONSENSUS GDP FORECAST Annual Growth Rate predicted RMSE = 1.4 percentage points actual 07 04 02 03 06 05 97 00 01 96 98 99 94 95 92 93
Forecaster Accuracy (t-stat of the average individual forecasters’ average percentile, n=85) Relatively Good at CPI Relatively Bad at GDP Relatively Bad at Both Average Growth Accuracy Relatively Good at GDP Relatively Bad at CPI Relatively Good at Both Average Inflation Accuracy
Probability of Repeating as a Good GDP Forecaster Probability of remaining ABOVE the median after… observed expected One success 48.9% 49.5% Two successes 25.4% 24.5% Three successes 14.0% 12.1% Four successes 8.0% 6.0% Five successes 3.5% 3.0%
WHY BOTHER WITH A FORECAST? • Most forecasts can beat a coin flip. • I can’t beat the consensus (and neither can anyone else.) • Forecasts are useful for risk assessment. • Forecasts are useful as a means for evaluating policy options. 15 15
AFTER A STRONG QIV, EVEN THE “OPTIMISTS” THINK THE ECONOMY WILL FOLLOW A MODERATE GROWTH PATH. Blue Chip GDP Forecast Annualized quarterly percent change Actual Forecast --- top ten --- bottom ten SOURCES: Blue Chip panel of economists, March 10, 2010.
AFTER A STRONG QIV, EVEN THE “OPTIMISTS” THINK THE ECONOMY WILL FOLLOW A MODERATE GROWTH PATH. Blue Chip GDP Forecast Annualized quarterly percent change Actual SOURCES: Blue Chip panel of economists, March 10, 2010.
YEAH, OUR MODELS DON’T HANDLE NON-LINEARITIES WELL… Blue Chip GDP Forecast Annualized quarterly percent change Actual Forecast SOURCES: Blue Chip panel of economists, March 10, 2010.
YEAH, OUR MODELS DON’T HANDLE NON-LINEARITIES WELL… Blue Chip GDP Forecast Annualized quarterly percent change Actual Forecast 70% SOURCES: Blue Chip panel of economists, March 10, 2010.
YEAH, OUR MODELS DON’T HANDLE NON-LINEARITIES WELL… Blue Chip GDP Forecast Annualized quarterly percent change Actual Forecast 70% SOURCES: Blue Chip panel of economists, March 10, 2010.
SO WHAT ARE THE RISKS? • Risk 1: History beats economics (+) • Risk 2: The housing correction still has a way to go (-) • Risk 3: Business Investment languishes (-) • Risk 4: Foreign economies continue to struggle. • Risk 5: Fiscal and other imbalances including state and local governments(-) 21 21
“ECONOMIC” MODELS, HOWEVER, POINT TO A BREAK FROM OUR STATISTICAL HISTORY Blue Chip GDP Forecast Annualized quarterly percent change Actual Forecast SOURCES: Blue Chip panel of economists, March 10, 2010. 22
“ECONOMIC” MODELS, HOWEVER, POINT TO A BREAK FROM OUR STATISTICAL HISTORY Blue Chip GDP Forecast Annualized quarterly percent change Statistical (BVAR) model projection Actual Forecast SOURCES: Blue Chip panel of economists, March 10, 2010. 23
AMONG THE MODERATING INFLUENCES, CONSUMER SPENDING IS EXPECTED TO RECOVER RELATIVELY SLOWLY THROUGH 2010-11 Blue Chip Real PCE Forecast annualized quarterly percent change Forecast Actual --- top ten --- bottom ten SOURCES: Blue Chip panel of economists, January 10, 2010. 24
THIS WOULD BE A HUGE BREAK FROM HISTORICAL EXPERIENCE. Blue Chip Real PCE Forecast annualized quarterly percent change Forecast Actual --- top ten --- bottom ten SOURCES: Blue Chip panel of economists, January 10, 2010. 25
REAL INCOMES HAVE BEEN HELD UP BY TRANSFERS, BUT REAL LABOR INCOME, THOUGH IMPROVING, WAS STILL DOWN YEAR-OVER-YEAR IN JANUARY. Source: Bureau of Economic Analysis *assumes recession ended in July 2009 26
YET CONSUMER CREDIT EXTENTIONS WERE STILL DECLINING IN DECEMBER AND WERE SOFT IN JANUARY. *assumes recession ended in July 2009 27
AFTER RISING ABOVE 6% LAST YEAR, THE HOUSEHOLD SAVING RATE HAS FALLEN BACK UNDER 4% AS CONSUMER SPENDING HAS GROWN. Source: Bureau of Economic Analysis *assumes recession ended in July 2009 28
SO WHAT ARE THE RISKS? • Risk 1: History beats economics (+) • Risk 2: The housing correction still has a way to go (-) • Risk 3: Business Investment languishes (-) • Risk 4: Foreign economies continue to struggle. • Risk 5: Fiscal and other imbalances including state and local governments(-) 29 29
HOME SALES HAVE SLOWED OVER THE PAST THREE MONTHS AND THE STOCK OF UNSOLD HOMES IS RISING AGAIN. January 2010
THE PENDING HOME SALES CONFIRMS A SHARP SLOWING IN SALES ACTIVITY OVE THE NEAR-TERM. 31
THE “SHADOW” INVENTORY OF UNSOLD HOMES MAY BE UNUSUALLY LARGE, AND DOWNWARD PRICE PRESSURE COULD BE PERSISTENT. March 2010
HOME PRICES, WHICH STABILIZED EARLY LAST YEAR, HAVE RECENTLY TILTED DOWNWARD AGAIN.
SO WHAT ARE THE RISKS? • Risk 1: History beats economics (+) • Risk 2: The housing correction still has a way to go (-) • Risk 3: Business Investment languishes (-) • Risk 4: Foreign economies continue to struggle. • Risk 5: Fiscal and other imbalances including state and local governments(-) 34 34
OUR “ECONOMIC” MODEL, ALSO POINTS TO A BREAK FROM STATISTICAL HISTORY, WITH WEAK INVESTMENT (RELATIVE TO HISTORY) Blue Chip GDP Forecast Annualized quarterly percent change Statistical model projection Actual Forecast DSGE model SOURCES: Blue Chip panel of economists, March 10, 2010. 35
BUSINESS SPENDING ON CAPITAL GOODS, WHICH HAD BEEN SHOWING SIGNS OF IMPROVEMENT HAS BEEN FLAT OVER THE PAST TWO MONTHS. Source: U.S. Census Bureau 36
BUT PURCHASING MANAGERS AT MANUFACTURING ESTABLISHMENTS ARE REPORTING GOOD ACTIVITY—AND ORDERS—FOR FEBRUARY. Source: Institute for Supply Management *assumes recession ended in July 2009 37
SO WHAT ARE THE RISKS? • Risk 1: History beats economics (+) • Risk 2: The housing correction still has a way to go (-) • Risk 3: Business Investment languishes (-) • Risk 4: Foreign economies continue to struggle. • Risk 5: Fiscal and other imbalances including state and local governments(-) 38 38
GROWTH IS EXPECTED ABROAD AS WELL, BUT AT AN EVEN MORE SUBDUED PACE THAN WHAT IS EXPECTED FOR THE U.S. AND LIKELY WITH A MORE FRAGILE BANKING SECTOR.
SO WHAT ARE THE RISKS? • Risk 1: History beats economics (+) • Risk 2: The housing correction still has a way to go (-) • Risk 3: Business Investment languishes (-) • Risk 4: Foreign economies continue to struggle. • Risk 5: Fiscal and other imbalances including state and local governments(-) 40 40
STATE BUDGET PROBLEMS REMAIN A MAJOR RISK TO THE ECONOMIC OUTLOOK IN 2010-2011.
BUT THIS IS A VERY FRAGILE SOURCE OF SPENDING • To date state budgets which tend to rely on income and sales taxes have suffered collapsing revenue and (to a lesser extent) increasing service demands (especially Medicaid). • Local property taxes have held up better because of assessments lags and more flexible millage rates but local governments have greater service demands, less state aid and shrinking property digests. • -Rockefeller Institute of Government • States had to close a collective $145 billion gap in the 2009-10 budgets. States budget officers currently project an additional shortfall of $28.2 billion for 2010-11. • -National Conference of State Legislatures
BUT THIS IS A VERY FRAGILE SOURCE OF SPENDING • Despite this, budget cuts and tax increases have been mitigate by the ARRA (stimulus) which provided $60B and $73B in 2009 and 2010 but falls to $30B for 2011 on. -CEA, CBO. • California, which has the lowest credit score of any US state (BBB,Baa1,A-), pays a risk premium on its debt between that of Spain and Greece. -FRBA calculation • State reserves are largely depleted and public employee pension are heavily underfunded suggesting that state and local budgets will be especially lean in coming years as these balances are re-built.
JOBS REDUCTIONS HAVE IMPROVED, BUT “GROWTH” IS STILL NOT IN THE PICTURE. Source: U.S. Bureau of Labor Statistics
THERE HAS BEEN A NOTABLE RISE IN THE HIRING OF TEMPORARY WORKERS—PERHAPS A SIGN OF IMPROVING LABOR DEMAND AMID UNCERTAINTY ABOUT THE SUSTAINABILITY OF THE EXPANSION 46
WHAT KIND OF JOB GROWTH IS NECESSARY TO BRING DOWN UNEMPLOYMENT? Threshold to materially reduce unemployment under “ordinary” assumptions` Source: U.S. Bureau of Labor Statistics
ADDING THE INVOLUNTARY PART-TIMERS AND DISCOURAGED WORKERS TO OFFICIALLY UNEMPLOYED WORKERS RAISES THE RATE OF JOBLESSNESS TO NEAR 17 PERCENT. *Note: Marginally attached workers currently want a job and have looked for work within the last 12 months. This primarily includes discouraged workers (those not currently looking for work because they believe no work is available given their circumstance), and persons not now working due to family responsibilities, ill-health, or are in school. Source: U.S.Bureau of Labor Statistics 48
RISING PRODUCTIVITY AND LABOR FORCE GROWTH IMPLY THAT THE MODEST GROWTH SCENARIO WILL BE INSUFFICIENT TO SIGNIFICANTLY CUT INTO THE RATE OF JOBLESSNESS Blue Chip Unemployment Rate Forecast ACTUAL UNEMPLOYMENT RATE FORECAST Quarter Average 2.2% growth 3% growth SOURCES: Blue Chip panel of economists, March 10, 2010. 49
FORECASTING INFLATION The conventional approach to forecasting inflation is called, variously, a Phillips curve forecast, an expectations augmented Phillips curve, and the New Keynesian Phillips curve. While there may be significant theoretical motivations that distinguish these approaches, they all tend to share three common elements that, with varying degrees of weight, determine the inflation prediction: π =f (slack in the economy, inflation expectations, commodity prices) Import prices Lagged inflation Survey data Oil prices GDP GAP Capacity Utilization Raw materials Unemployment relative to NAIRU (“Phillips curve”)