Download

1 / 25
270 likes | 490 Views
Biodiversity. How has the diversity of multicellular life changed over time?. Multicellular life started from only one kind and is now many kinds, so, duh. Yes, the number of different kinds of organism must have increased over time.

E N D
How has the diversity of multicellular life changed over time? • Multicellular life started from only one kind and is now many kinds, so, duh. Yes, the number of different kinds of organism must have increased over time. • BUT has it been a steady increase? Is diversity still increasing now? Or has the earth reached some kind of limit on the number of kinds of creatures that can exist?
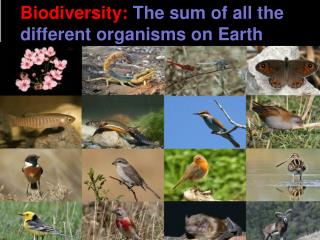
Look at the numbers • How many species are there now? • About 1.8 million species of plants and animals described • Is that all there is? How could you know how many more there might be? • Estimates range from 5 million to 20+ million • How many fossil species are there? • About 300,000 have been named • Hard to figure out from this how many species have lived
Why is it hard to figure out past diversity? • Level of tabulation: • Species problem – are we accurately recognizing species? Some groups probably overestimated, others underestimated. • Orders and above are pretty far from natural groups and are contentious • Family level is reasonable compromise – close to natural classification but easier to recognize than species
Why is it hard to figure out past diversity? • Missing groups: unfossilizable taxa • Perhaps at some times there were many soft-bodied organisms contributing to diversity • The insect problem – unfossilizable but most of the described species
Remember this? Two thirds of all described multicellular life are insects
Why is it hard to figure out past diversity? • Discovered fossil problem – sampling depends on: • Exposure of rocks of that age • Volume of rocks of that age • Silurian-Devonian transgression means there’s a lot of fossils of that age, Carboniferous regression means there’s few of that age • Interest of paleontologists – different ages have attracted different amounts of attention from paleontologists • Ease of access, economics, coolness factor
Why is it hard to figure out past diversity? • “Pull of the Recent”: tops of fossil ranges are usually underestimates EXCEPT for extant species. • So living families count more (e.g. are represented in more time periods) than extinct ones.
So what can we do with the data we have? • Look at family or genus level data for skeletonized marine invertebrates • Eliminates the problem of identifying species • Helps standardize identification (researchers may be splitters or lumpers when it comes to species, but families are universally recognized) • Eliminates the problem of selective preservation – we’re only comparing critters with hard parts across time • Eliminate the insect bulge
What kinds of patterns could we see? • Equilibrium: there is a limit on the number of species (families) that can exist, determined by physical or ecological factors • Expansion: either there is no limit on the number of kinds of organisms, or we haven’t reached that limit yet
Possible ways diversity could increase: • Exponential: what you would expect if speciation and extinction rates stay constant. • Linear: implies that speciation rates decline, or extinction rates increase • S-shaped curve: diversity rises quickly at first, then levels out as the Earth approaches some limit on how many species there could be
What are the patterns? • Two S-shaped curves: in the Cambrian, then the Ordovician • Rising diversity through the Ordovician, then Paleozoic plateau marked by a few extinctions. • Big extinction event at end of Permian lowers diversity. • Mesozoic to Cenozoic: increasing diversity (linear?), with downward blip at Cretaceous-Paleogene extinction. So… Expansion or equilibrium? Constant speciation rates (exponential) OR Decreasing speciation rates or increasing extinction rates OR Speciation rates damped by outside forces? (S-shaped curve)
More detailed analysis: We can recognize three great faunas in the history of life: Cambrian Paleozoic Modern
The three faunas • Cambrian: Trilobites, lingulate brachiopods, archeocyathids, primitive echinoderms • Paleozoic: rhynchonelliform brachiopods, stony bryozoans, stromotoporoids, cephalopods, crinoids, blastoids, graptolites • Modern: bivalves, gastropods, echinoids, crustaceans, vertebrates
The three faunas ecologically • Cambrian: benthic organisms living only a few cm above & below sea floor • Paleozoic: sessile (attached) benthic organisms, some rising above sea floor up to a meter or so, slightly deeper burrows • Modern: more mobile benthic fauna, deeper burrowers, swimmers, abundant planktonics
Notice that the faunas exist outside of the time period they are named for, but are most important during the time period of their name.
But maybe the way we are looking at the data is not valid… • Sepkowski’s database is by time period (first and last) • But the time periods are not the same length • His analysis did not statistically account for other biases: rock volume, abundance, intensity of sampling.
A new approach: Alroy and others, 2001 • Divide the Phanerozoic into equally sized time periods • Sample the existing collections to statistically simulate equally sized collections • Perform rarefaction to evaluate whether the number of groups represented is an accurate picture of the total number of groups that would have been alive
Rarefaction • A method of statistically determining the maximum expected number of different kinds of things in a collection by repeated sampling. • If lets you estimate how many more different kinds of things you should have found that you didn’t
Rarefaction activity • Create a data table: # of items, # of kinds • Reach in your bag of gumballs and pick one without looking. • On your data sheet, record the number of items you sampled (1) and the number of kinds of things you found (1). Duh. • Put the gumball back. • Now sample 2 gumballs. How many different kinds do you have? Record your data. Put the gumballs back. • Continue the process. Each time you will sample one more gumball then the last time.
So what did Alroy find with this new method of analysis? • The Paleozoic plateau is gone • Instead there are peaks of diversity in Devonian and Permian • The Cenozoic increase is there, but not as dramatic, and seems to be plateau in Neogene
Another way to explore this question… • Rarefaction curves separated by latitude for Ordovician show similar numbers of genera in both tropics and nontropics, but in Neogene there’s a big difference between the two. • There are probably still more Neogene tropical species to be found. – the curve has not yet flattened out. • There are many more Neogene genera overall than in Ordovician.
So what to conclude? • The increase in Cenozoic diversity seems to be real but less dramatic than previously thought. • No good evidence one way or another on whether there’s a limit to possible diversity • Diversity levels may be linked to plate configurations or climate: • Decrease in Paleozoic may track Pangaea formation • Cenozoic increase may track increasing latitudinal difference in climate.