Download

1 / 18
180 likes | 329 Views
Phillips Neighborhood Environmental Inventory. Shane Pittman MGIS Student University of Minnesota. Outline. Background Project Steps Results Conclusions Questions. Background. GreenSpace Partners of the Phillips neighborhood in Minneapolis Non-profit organization

E N D
Phillips Neighborhood Environmental Inventory Shane Pittman MGIS Student University of Minnesota
Outline • Background • Project Steps • Results • Conclusions • Questions
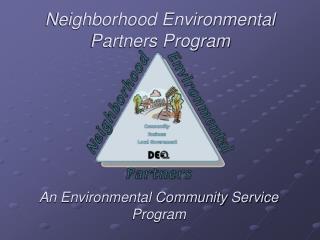
Background • GreenSpace Partners of the Phillips neighborhood in Minneapolis • Non-profit organization • Goal: Ensure that community development projects respect the community’s need for greenspace • Revive the Phillips Neighborhood Environmental Inventory • Use as a neighborhood planning tool
Background (cont.) • Five Categories of Data: • Sources of Pollution • Urban Greenspace • Transportation and the Built Environment • People • Social Infrastructure
Background (cont.) • Capstone project for MGIS program • “GIS and the Internet: Tools for Neighborhood Access to Information” • Research question • “Which type of website is more effective in the display of geographic information at the neighborhood level: a website that shows pre-constructed static maps or one that contains an interactive map server?”
Project Steps • Data Collection • Website Construction • User Survey
Data Collection • Salvage data from previous PNEI project • Collect new layers • Online sources • Neighborhood contacts • Field collection • GreenSpace Partners
Website Construction • Create Internet Map Server • Mapserver • Map file • Template file • Query Results pages • Help page • Metadata
Website Construction (cont.) • Create Static Maps • PDF files • Eight maps • Greenspace • Pollution Sites & Greenspace • Neighborhood Facilities & Greenspace • Land Use • Property Values • Census 2000: Percent Non-White • Census 2000: Percent Less Than 21 Years Old • Census 2000: Population Density (per Square Mile)
User Survey • Formulate questions • General Information • Quantitative and Qualitative • Appearance • Difficulty of Use • Content • Usefulness • Overall • Distribute survey after website launch
Results • 20 survey respondents • General Information • Varied Internet connections • 68.4% - High speed connection • 31.6% - Dial-up modem
Results (cont.) • Appearance • Positive reactions for both the Internet Map Server and Static Maps • Difficulty of Use • Positive reaction for Static Maps • Mixed reaction for the Internet Map Server
Results (cont.) • Content • Satisfaction with the data content of the Internet Map Server • Less satisfaction with the content of Static Maps • Usefulness • Both the Internet Map Server and Static Maps were deemed useful
Results (cont.) • Overall • Respondents would use the two sections of the website equally • They indicated that the website is useful • A majority of them estimated they would use the website less than 30 minutes a week
Conclusions • Answer to research question • Internet Map Server and Static Maps are equally effective • Complementary • Each useful in different scenarios • Internet Map Server better for site-specific data • Static Maps better for neighborhood-scale data
Conclusions (cont.) • Know your audience • Non-technical audience • Simple is better • Unnecessary additional features can hinder users from obtaining the full benefits of an Internet Map Server • More complicated websites and lengthy instructions can overwhelm users and discourage them from using an Internet Map Server
Questions? PNEI Website http://www.socsci.umn.edu/~pitt0031