Download
1 / 13
130 likes | 158 Views
Study on tropical cirrus formation using balloon-borne backscatter measurements and microphysical simulations in the TTL, comparing model results with observed data. Analysis of backscatter ratios, water vapor profile, and gas phase concentrations.

E N D
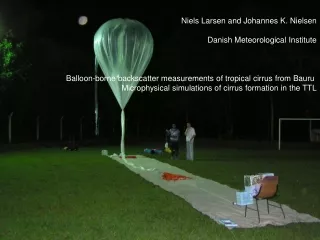
Niels Larsen and Johannes K. Nielsen Danish Meteorological Institute Balloon-borne backscatter measurements of tropical cirrus from Bauru Microphysical simulations of cirrus formation in the TTL
Particle layer in the lowest stratosphere Ultra-thin cirrus at the tropopause
Input Temperature Pressure Partial pressure of H2O Partial pressure of HNO3 Number densities of resolved aerosol types Amount of acid and water in each size bin The DMI microphysical model has been used to simulate cirrus layers in the TTL, observed with the micro-lidar (Cairo and Didonfrancesco) during the SF4 flight on 24 February 2004 from Bauru. Preliminary model results are compared with the observed backscatter ratios and the measured water vapour profile.
RAMS-model airparcel trajectories, provided by Nathalie Huret, have been used as input to the microphysical model. Assuming that trajectories lie above each other during the last 36 hours and span a vertical ’curtain’, particle sedimentation between layers can be simulated. Temperatures have been interpolated in 10 potential-temperature equidistant layers (black curves) in the vertical curtain between the RAMS levels (coloured curves).
Calculated backscatter ratio from background aerosol and cirrus during the 36 hours simulation prior to 22 UT. Cirrus formation takes place around -33 and – 22 hours and in the uplift during the final 3 hours.
The final 3 hours of the simulation where cirrus particles form and sediment out of the airparcels. These final three hours of simulation results can be compared to the measured backscatter by the microlidar, assuming that the calculated airparcels nearly follow the balloon (which may not exactly be the case!).
Micro-lidar measurements (Cairo and Didonfrancesco) Notice: The colour scales do not match Remarks on simulation: Altitude fairly well Backscatter ratios lower than measured The curtain method is rather crude and fine scale features are not simulated
Calculated gasphase concentrations of water vapour. The final vertical profile can be compared to the measured profile.
Further work: Back trajectories from SF4 cut down position would be useful, perhaps with higher vertical resolution. The assumption that trajectories follow each other is questionable, at least regarding the upper level RAMS- trajectory used (red curve showing the 36 hours trajectory). More levels will be added to the curtain simulations. RAMS 3-D wind/temperature fields would be useful for the DMI Eulerian advection microphysical model to make simulations of the observed cirrus formation.