
Topographic Maps
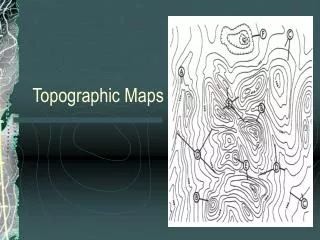
Topographic Maps. What is a Topographic Map?. Topographic maps are special maps that show the relief (highs and lows) of Earth’s surface. Topographic maps are different from regular maps because they use isolines in addition to everything else. What is an Isoline?.

Topographic Maps
E N D
Presentation Transcript
What is a Topographic Map? • Topographic maps are special maps that show the relief (highs and lows) of Earth’s surface. • Topographic maps are different from regular maps because they use isolines in addition to everything else.
What is an Isoline? • Isolines are lines that connect equal values. • The values are different depending on the map being used. • Types of Isolines: • Isotherms – connect equal points of temperature • Isobars – connect equal points of air pressure • Contour lines – connect equal points of elevation
Contour Lines • For topographic maps, contour lines are the type of isoline used to show equal points of elevation. • They look like the background of this powerpoint presentation! • Contour lines show three different things on topographic maps: • Elevation of the land • Shape of the land • Steepness of the slopes
Contour Lines • Contour lines look like this: • All the points on the 200 line equal 200 meters, all along the 300 equal 300 meters, etc. • We know the elevation is in meters because it tells us at the bottom of the map. • By using contour lines, we can take a real-life, 3-dimensional hill and draw it on a flat, 2-dimensional map!!! Elevations in meters
Reading Contour Lines • The contour interval is the amount between each line. • The contour interval in this map is 100 meters since each line goes up by 100.
Reading Contour Lines • Usually, not every line is labeled for you. It will either tell you the contour interval at the bottom of the map, or you will have to figure it out. 50 100 150 300 250 200 Contour Interval = 100 m
Reading Contour Lines • The closer the contour lines are to each other, the steeper the hill. • The further away the contour lines are from each other the more gentle the hill. GENTLE!! STEEP!!
Reading Contour Lines • Each line goes UP by the contour interval unless it is a hatchured contour. Those indicate depressions (holes). • The first hatchured contour after a regular is the SAME value as the one that came before it, then each one after that goes DOWN by the contour interval. • Then the first regular contour after a hatchured is the same as the hatchured before it and then they go UPby the contour interval after that.
Estimating Elevations • If a point is right on a contour line, you definitely know it’s elevation. But, if it’s in-between 2 contour lines, you must estimate. B We know for sure point B is 200 m because it’s right on the 200 m contour line. We don’t know point A’s elevation for sure though. It’s probably about 350 m
Other Contour Line Rules • Contour lines NEVER cross each other! • Contour lines NEVERsplit! • Contour lines MUST begin and end at the edge of the map…cannot start or end them in the middle of the map.
Drawing Contour Lines • You must ALWAYS connect points of equal value!! Kind of like connect the dots when you were little! • The lines you draw should be gentle, curving lines, no sharp angles or edges.
CORRECT!!! 5 10 5 10 10 15 10 15
NOT CORRECT!!! 5 10 5 10 10 15 10 15
Gradient • Gradientis the average slope of a particular area on a map. • You can calculate gradient for any map that has isolines. • Formula:Change in field value Distance Formula is on page 1 of ESRT!!!
Gradient • The field value is whatever the map is measuring. • If it’s a topo map, it’s elevation. • If it’s a weather map it’s probably air pressure(isobars) or temperature(isotherms). • The distance is just the distance found between the 2 points given using the map scale.
Example Gradient = change in field value Distance B Gradient = 350 m – 200 m 2.3 miles Gradient = 150 m 2.3 miles Gradient = 65.2 meters/mile Elevation in meters 0 .5 1 2 miles


