Download
1 / 24
240 likes | 414 Views
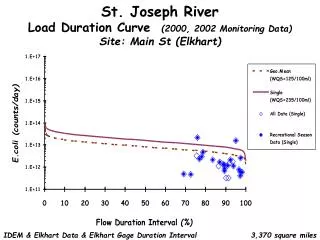
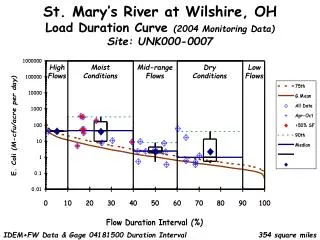
St. Mary’s River at Wilshire, OH Load Duration Curve (2004 Monitoring Data) Site: UNK000-0007. High Flows. Moist Conditions. Mid-range Flows. Dry Conditions. Low Flows. IDEM+FW Data & Gage 04181500 Duration Interval. 354 square miles.

E N D
St. Mary’s River at Wilshire, OHLoad Duration Curve (2004 Monitoring Data)Site: UNK000-0007 High Flows Moist Conditions Mid-range Flows Dry Conditions Low Flows IDEM+FW Data & Gage 04181500 Duration Interval 354 square miles
St. Mary’s River at Pleasant MillsLoad Duration Curve (2004 Monitoring Data)Site: LES040-0007 High Flows Moist Conditions Mid-range Flows Dry Conditions Low Flows IDEM Data & Gage 04181500 Duration Interval 468 square miles
St. Mary’s River near PoeLoad Duration Curve (2004 Monitoring Data)Site: LES060-0006 High Flows Moist Conditions Mid-range Flows Dry Conditions Low Flows IDEM+FW Data & Gage 04181500 Duration Interval 643 square miles
St. Mary’s River at Pleasant MillsLoad Duration Curve (1988 - 2004 Monitoring Data)Site: STM-37 High Flows Moist Conditions Mid-range Flows Dry Conditions Low Flows IDEM Data & Gage 04181500 Duration Interval 468 square miles
St. Mary’s River at Ferguson RoadLoad Duration Curve (1991 - 2000 Monitoring Data)Site: STM-11 High Flows Moist Conditions Mid-range Flows Dry Conditions Low Flows IDEM Data & Gage 04182000 Duration Interval 762 square miles
St. Mary’s River at Ferguson RoadLoad Duration Curve (2001-04 Monitoring Data)Site: STM-FER High Flows Moist Conditions Mid-range Flows Dry Conditions Low Flows FW Data & Gage 04182000 Duration Interval 762 square miles
St. Mary’s River at Spy Run BridgeLoad Duration Curve (1988 - 2000 Monitoring Data)Site: STM-.2 High Flows Moist Conditions Mid-range Flows Dry Conditions Low Flows IDEM Data & Gage 04182000 Duration Interval 820 square miles
St. Mary’s River at Spy Run BridgeLoad Duration Curve (2001-04 Monitoring Data)Site: STM-SPY High Flows Moist Conditions Mid-range Flows Dry Conditions Low Flows FW Data & Gage 04182000 Duration Interval 820 square miles
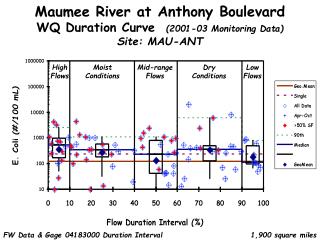
Maumee River at Anthony BoulevardLoad Duration Curve (2001-03 Monitoring Data)Site: MAU-ANT High Flows Moist Conditions Mid-range Flows Dry Conditions Low Flows FW Data & Gage 04183000 Duration Interval 1,900 square miles
Maumee River at Landin RoadLoad Duration Curve (2001-03 Monitoring Data)Site: MAU-LAN High Flows Moist Conditions Mid-range Flows Dry Conditions Low Flows FW Data & Gage 04183000 Duration Interval 1,967 square miles
Maumee River at Landin RoadLoad Duration Curve (1991 - 2000 Monitoring Data)Site: M-129 High Flows Moist Conditions Mid-range Flows Dry Conditions Low Flows IDEM Data & Gage 04183000 Duration Interval 1,967 square miles
Maumee River near WoodburnLoad Duration Curve (1991 - 2000 Monitoring Data)Site: M-114 High Flows Moist Conditions Mid-range Flows Dry Conditions Low Flows IDEM Data & Gage 04183000 Duration Interval 2,050 square miles
Blue Creek -- Salem RoadLoad Duration Curve (2004 Monitoring Data)Site: LES040-0011 High Flows Moist Conditions Mid-range Flows Dry Conditions Low Flows IDEM Data & Gage 03324000 / 04182590 Duration Interval 51.8 square miles
Blue Creek -- CR 300 SLoad Duration Curve (2004 Monitoring Data)Site: LES040-0066 High Flows Moist Conditions Mid-range Flows Dry Conditions Low Flows IDEM Data & Gage 03324000 / 04182590 Duration Interval 71.0 square miles
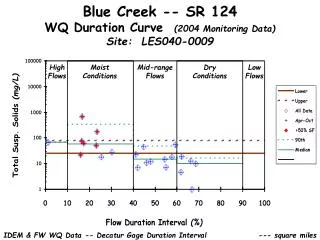
Blue Creek -- SR 124Load Duration Curve (2004 Monitoring Data)Site: LES040-0009 High Flows Moist Conditions Mid-range Flows Dry Conditions Low Flows IDEM+FW Data & Gage 03324000 / 04182590 Duration Interval 79.6 square miles
Habegger Ditch -- CR 150 ELoad Duration Curve (2004 Monitoring Data)Site: LES040-0099 High Flows Moist Conditions Mid-range Flows Dry Conditions Low Flows IDEM Data & Gage 03324000 / 04182590 Duration Interval 8.4 square miles
Gates Ditch -- CR 400 SLoad Duration Curve (2004 Monitoring Data)Site: LES040-0023 High Flows Moist Conditions Mid-range Flows Dry Conditions Low Flows IDEM Data & Gage 03324000 / 04182590 Duration Interval 20.1 square miles
Little Blue Creek -- CR 400 SLoad Duration Curve (2004 Monitoring Data)Site: LES040-0010 High Flows Moist Conditions Mid-range Flows Dry Conditions Low Flows IDEM Data & Gage 03324000 / 04182590 Duration Interval 16.3 square miles
Martz Creek -- CR 200 NLoad Duration Curve (2004 Monitoring Data)Site: LES040-0040 High Flows Moist Conditions Mid-range Flows Dry Conditions Low Flows IDEM Data & Gage 03324000 / 04182590 Duration Interval 9.8 square miles
Yellow Creek -- CR 250 SLoad Duration Curve (2004 Monitoring Data)Site: LES040-0038 High Flows Moist Conditions Mid-range Flows Dry Conditions Low Flows IDEM+FW Data & Gage 03324000 / 04182590 Duration Interval 24.5 square miles
Borum Run -- Mercer RoadLoad Duration Curve (2004 Monitoring Data)Site: LES040-0097 High Flows Moist Conditions Mid-range Flows Dry Conditions Low Flows IDEM Data & Gage 03324000 / 04182590 Duration Interval 14.4 square miles
Holthouse Ditch -- CR 200 WLoad Duration Curve (2004 Monitoring Data)Site: LES050-0008 High Flows Moist Conditions Mid-range Flows Dry Conditions Low Flows IDEM+FW Data & Gage 03324000 / 04182590 Duration Interval 27.3 square miles
Nickelsen Creek – CR 1100 NLoad Duration Curve (2004 Monitoring Data)Site: LES050-0015 High Flows Moist Conditions Mid-range Flows Dry Conditions Low Flows IDEM+FW Data & Gage 03324000 / 04182590 Duration Interval 12.2 square miles
Unnamed Tributary -- Barkley RoadLoad Duration Curve (2004 Monitoring Data)Site: LES050-0020 High Flows Moist Conditions Mid-range Flows Dry Conditions Low Flows IDEM+FW Data & Gage 03324000 / 04182590 Duration Interval 2.3 square miles