Download
1 / 12
120 likes | 228 Views
LIGO-C030208-00 April 2003. Université. SMA. Lyon I. Large sapphire substrate absorption measurements for LIGO. Sapphire substrate from Crystal Systems Inc. Boule N° AJ5, L46. S.M.A.- VIRGO Université Claude Bernard LYON I IPNL - IN2P3 – CNRS

E N D
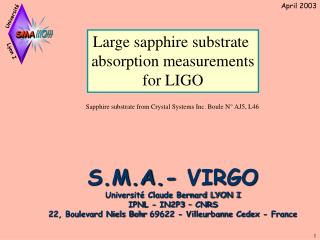
LIGO-C030208-00 April 2003 Université SMA Lyon I Large sapphire substrate absorption measurements for LIGO Sapphire substrate from Crystal Systems Inc. Boule N° AJ5, L46 S.M.A.- VIRGO Université Claude Bernard LYON I IPNL - IN2P3 – CNRS 22, Boulevard Niels Bohr69622 - Villeurbanne Cedex - France 1
Large sapphire substrateabsorption measurementsfor LIGO • Orientation of the substrate • The sapphire substrate is slightly damaged at the edge of one side. For all the measurements, the substrate is positioned so that the defects are in the front and at the bottom of the substrate (slide # 3). • Accuracy of the absorption measurements • The absolute value of the sapphire absorption is calculated thanks to the measurement of the absorption of a silica reference, the density and the specific heat capacity of sapphire and silica. The modulation frequency used for the measurement was high: 3000 Hz. • The absorption of the silica reference is calculated thanks to the measurement of the absorption of ultra pure water (0.13 cm-1), the density and the specific heat capacity of silica and water. A cross calibration was made with the Laboratoire d’Optique at ESPCI Paris. The agreement is in the percent range. • Moreover, we recorded during 3 hours and 20 minutes the absorption of the center part of the sapphire substrate in order to check the stability of the measurement. We got: 30.0 +/- 0.3 ppm.cm-1 (slide # 3). • Elementary volume measured by our photothermal deflection bench • The elementary volume scanned by the absorption measurement depends on the waists of the probe and the pump beams (100 µm x 100 µm) and on the interaction length of probe and pump beams (3 mm). The interaction lenght is set by the angle between probe and pump beams: 3.5° (slide # 3). • Artifacts due to non-photothermal deflection of the probe • One drawback of the photothermal deflection technique is that the measured absorption is deduced from the deflection of the probe beam. • If the deflection is only due to a photothermal effect, than the absorption measurement is correct, but if the deflection is due to scratches, small inclusions, refractive index variations of the substrate, … than the absorption measurement is wrong. In order to estimate the artifacts due to non-photothermal deflection of the probe, we recorded an « absorption » map, without the pump laser. The maximum artifact is 1.4 ppm.cm-1 and the mean value is 0.4 ppm.cm-1 • (slide# 4). These values are high compared to what we would have with a super polished substrate without scratches nor inclusions but they are negligible compared to the absorption of the sapphire which is always higher than 30 ppm.cm-1. • Absorption vs depth • At 3 different (X,Y) positions, we scanned the absorption versus the depth (Z). The ranges of absorption variation for each (X,Y) position are: • [32-36 ppm.cm-1] , [45-74 ppm.cm-1] and [67-127 ppm.cm-1]. At Z=0 and Z=-131 mm, the absorption is influenced by the « inspection polished » surfaces (slide # 5). • Absorption maps • We recorded 6 maps at 6 different depths. The diameter of the maps is 200 mm and the step between the points is 2.5 mm. The general shape of all the maps doesn’t change very much (slide # 6), but for each map,the absorption varies from 30 to 130 ppm.cm-1(slides # 7-12). We recorded two zooms with small steps of 0.1 mm on 2 pixels of the previous maps. The zooms show variation of absorption at the 0.1mm scale. (slides # 9;10). 2
Y X 0 Z Y Z X • Orientation of the substrate: • 314 mm Defects in the front at the bottom 131 mm thick • Accuracy of the absorption measurements : +/- 0.3 ppm.cm-1 • Absorption recorded at • X = 0 mm • Y = 1 mm • Z = -57 mm • during 3h 20mn: • 30.0 +/- 0.3 ppm.cm-1 • Elementary volume measured by our photothermal deflection bench: X 0.1 mm Y 0.1 mm Z 3 mm 3
Artifacts due to non-photothermal deflection of the probe are in the sub-ppm.cm-1 range. Mean absorption: 0.45 ppm.cm-1 f 200 mm scan 4 mm steps Z = -74 mm In this experiment, the YAG is switched off, in order to evaluate the influence of scratches, small inclusions, refractive index variations, … on the deflection of the probe laser. 4
Absorption vs depth Max = 36.0 ppm.cm-1 Min = 32.2 ppm.cm-1 X = 0 mm Y = 0 mm Z = -68 mm Max = 74.4 ppm.cm-1 Min = 45.3 ppm.cm-1 X = -50 mm Y = -5 mm Max = 127.3 ppm.cm-1 Min = 67.3 ppm.cm-1 X = -42.5 mm Y = -55 mm 5
Y X 0 Z • Absorption maps • at 6 different depths Z = -18 mm Z = -126 mm Z = -57 mm Z = -63 mm Z = -68 mm Z = -74 mm 6
Mean absorption: 57 ppm.cm-1 f 200 mm scan 2.5 mm steps Absorption map at Z = -18 mm 7
Mean absorption: 67 ppm.cm-1 f 200 mm scan 2.5 mm steps Mean absorption: 91 ppm.cm-1 30x30 mm² zoom 1 mm steps Absorption map at Z = -57 mm 8
Mean absorption: 67 ppm.cm-1 f 200 mm scan 2.5 mm steps Mean absorption: 101 ppm.cm-1 3.5x3.5 mm² zoom 0.1 mm steps Absorption map at Z = -63 mm 9
Mean absorption: 66 ppm.cm-1 f 200 mm scan 2.5 mm steps Mean absorption: 113 ppm.cm-1 3.5x3.5 mm² zoom 0.1 mm steps Absorption map at Z = -68 mm 10
Mean absorption: 62 ppm.cm-1 f 200 mm scan 2.5 mm steps Absorption map at Z = -74 mm 11
Mean absorption: 61 ppm.cm-1 f 200 mm scan 2.5 mm steps Absorption map at Z = -126 mm 12