Download

1 / 56
570 likes | 700 Views
This guide explores various sampling designs used for data collection, including surveys, opinion polls, and different sampling methods such as simple random sampling, stratified random sampling, cluster sampling, systematic sampling, and multistage sampling. It explains the concepts of population, sample, and sampling frame, and emphasizes the importance of selecting representative samples to generalize findings accurately. Providing real-world examples enhances understanding of each method, while also highlighting potential sources of bias that can affect data quality.

E N D
How do we gather data? • Surveys • Opinion polls • Interviews • Studies • Observational • Retrospective (past) • Prospective (future) • Experiments
the entire group of individuals that we want information about Population
A part of the population that we actually examine in order to gather information Use sample to generalize to population Sample
refers to the method used to choose the sample from the population Sampling design
a list of every individual in the population Sampling frame
consist of n individuals from the population chosen in such a way that every individual has an equal chance of being selected every set of n individuals has an equal chance of being selected Simple Random Sample (SRS) Suppose we were to take an SRS of 100 SHS students – put each students’ name in a hat. Then randomly select 100 names from the hat. Each student has the same chance to be selected! Not only does each student has the same chance to be selected – but every possible group of 100 students has the same chance to be selected! Therefore, it has to be possible for all 100 students to be seniors in order for it to be an SRS!
population is divided into homogeneous groups called strata SRS’s are pulled from each stratum Stratified random sample Homogeneous groups are groups that are alike based upon some characteristic of the group members. Suppose we were to take a stratified random sample of 100 SHS students. Since students are already divided by grade level, grade level can be our strata. Then randomly select 50 seniors and randomly select50 juniors.
based upon location randomly pick a location & sample all there Cluster Sample Suppose we want to do a cluster sample of SHS students. One way to do this would be to randomly select 10 classrooms during 2nd period. Sample all students in those rooms!
select sample by following a systematic approach randomly select where to begin Systematic random sample Suppose we want to do a systematic random sample of SHS students - number a list of students (There are approximately 2000 students – if we want a sample of 100, 2000/100 = 20) Select a number between 1 and 20 at random. That student will be the first student chosen, then choose every 20th student from there.
select successively smaller groups within the population in stages SRS used at each stage Multistage sample To use a multistage approach to sampling SHS students, we could first divide 2nd period classes by level (AP, Honors, Regular, etc.) and randomly select 4 second period classes from each group. Then we could randomly select 5 students from each of those classes. The selection process is done in stages!
Identify the sampling design 1)The Educational Testing Service (ETS) needed a sample of colleges. ETS first divided all colleges into groups of similar types (small public, small private, etc.) Then they randomly selected 3 colleges from each group. Stratified random sample
Identify the sampling design 2) A county commissioner wants to survey people in her district to determine their opinions on a particular law up for adoption. She decides to randomly select blocks in her district and then survey all who live on those blocks. Cluster sampling
Identify the sampling design 3) A local restaurant manager wants to survey customers about the service they receive. Each night the manager randomly chooses a number between 1 & 10. He then gives a survey to that customer, and to every 10th customer after them, to fill it out before they leave. Systematic random sampling
each entry is equally likely to be any of the 10 digits digits are independent of each other Numbers can be read across. Random digit table Numbers can be read vertically. The following is part of the random digit table found on page 847 of your textbook: Row 1 4 5 1 8 5 0 3 3 7 1 2 4 2 5 5 8 0 4 5 7 0 3 8 9 9 3 4 3 5 0 6 3 Numbers can be read diagonally.
Suppose your population consisted of these 20 people: 1) Aidan 6) Fred 11) Kathy 16) Paul 2) Bob 7) Gloria 12) Lori 17) Shawnie 3) Chico 8) Hannah 13) Matthew 18) Tracy 4) Doug 9) Israel 14) Nan 19) Uncle Sam 5) Edward 10) Jung 15) Opus 20) Vernon Use the following random digits to select a sample of five from these people. We will need to use double digit random numbers, ignoring any number greater than 20. Start with Row 1 and read across. 1) Aidan 13) Matthew 18) Tracy 15) Opus 5) Edward Ignore. Ignore. Ignore. Ignore. Stop when five people are selected. So my sample would consist of : Aidan, Edward, Matthew, Opus, and Tracy Row 1 4 5 1 8 0 5 1 3 7 1 2 0 1 5 5 8 0 1 5 7 0 3 8 9 9 3 4 3 5 0 6 3
A systematic error in measuring the estimate favors certain outcomes Bias Anything that causes the data to be wrong! It might be attributed to the researchers, the respondent, or to the sampling method!
things that can cause bias in your sample cannot do anything with bad data Sources of Bias
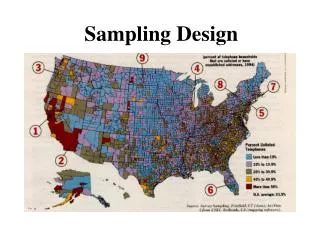
some groups of population are left out of the selection process People with unlisted phone numbers – usually high-income families People without phone numbers –usually low-income families People with ONLY cell phones – usually young adults Undercoverage Suppose you take a sample by randomly selecting names from the phone book – some groups will not have the opportunity of being selected!
People chose to respond Usually only people with very strong opinions respond Voluntary response An example would be the surveys in magazines that ask readers to mail in the survey. Other examples are call-in shows, American Idol, etc. Remember, the respondent selects themselves to participate in the survey! Remember – the way to determine voluntary response is: Self-selection!!
occurs when an individual chosen for the sample can’t be contacted or refuses to cooperate telephone surveys 70% nonresponse Nonresponse Because of huge telemarketing efforts in the past few years, telephone surveys have a MAJOR problem with nonresponse! People are chosen by the researchers, BUT refuse to participate. NOT self-selected! This is often confused with voluntary response! One way to help with the problem of nonresponse is to make follow contact with the people who are not home when you first contact them.
occurs when the behavior of respondent or interviewer causes bias in the sample wrong answers Response bias Suppose we wanted to survey high school students on drug abuse and we used a uniformed police officer to interview each student in our sample – would we get honest answers? Response bias occurs when for some reason (interviewer’s or respondent’s fault) you get incorrect answers.
Ask people who are easy to ask Produces bias results Convenience sampling The data obtained by a convenience sample will be biased – however this method is often used for surveys & results reported in newspapers and magazines! An example would be stopping friendly-looking people in the mall to survey. Another example is the surveys left on tables at restaurants - a convenient method!
wording can influence the answers that are given connotation of words use of “big” words or technical words – if surveying Podunk, AR, then you should avoidcomplex vocabulary. – if surveying doctors, then use more complex, technical wording. Wording of the Questions The level of vocabulary should be appropriate for the population you are surveying Questions must be worded as neutral as possible to avoid influencing the response.
1. A uniformed policeman interviews a group of 50 college freshmen. He asks each one his or her name and then if he or she as used an illegal drug in the last month. Selection bias Measurement or Response bias Nonresponse bias Systematic rejection bias
2. A survey about the food in the school cafeteria was conducted by passing out questionnaires to students as they entered the cafeteria. A drop box for completed forms was on a table by the cash register. Selection bias Measurement or Response bias Nonresponse bias Systematic rejection bias
3. The magazine Harley Davidson Today sent a survey to its subscribers asking whom they admire most in America. Selection bias Measurement or Response bias Nonresponse bias Systematic rejection bias
4. A poll of parents in Texas found that 90% of parents say they have spoken to their teenagers about the dangers of drinking and driving, while only 45% of those teens say they recall such a discussion. Selection bias Measurement or Response bias Nonresponse bias Systematic rejection bias
5. In a census in Russia, 1.8 million more women than men reported that they were married. Selection bias Measurement or Response bias Nonresponse bias Systematic rejection bias
6. One year after the Detroit race riots of 1967, interviewers asked a sample of black residents in Detroit if they felt they could trust most white people, some white people, or none at all. When the interviewer was white, 35% answered "most"; when the interviewer was black, 7% answered "most". Selection bias Measurement or Response bias Nonresponse bias Systematic rejection bias
7. A political party mailed questionnaires to all registered voters in Texas, asking whether or not the party should support the death penalty. The voters mailed the completed questionnaires back in an envelope provided. Selection bias Measurement or Response bias Nonresponse bias Systematic rejection bias
8. The Nielson rating service estimates the popularity of television stations in the Dallas area. Suppose that four times a year, Nielson takes a random sample of about 5000 viewers. Every member of the household over age 12 is asked to fill out a diary, showing what he or she watches every quarter hour from 6:00 am to midnight. Each diarist receives $5 for his or her trouble. At the end of 12 weeks, Nielson tallies the results from the usable diaries - usually between 33% and 50% of the 5000 sent out. Selection bias Measurement or Response bias Nonresponse bias Systematic rejection bias
9. In the 1936 presidential election, Franklin D. Roosevelt ran for reelection against Alfred Landon. As it had done since 1916, the Literary Digest, a popular magazine, ran a preelection poll. To obtain its sample, the magazine compiled a list of about 10 million names from sources such as telephone books, lists of automobile owners, club membership lists, and its own subscription lists. All 10 million people received questionnaires, about 2.4 million returned them; these people made up the sample. Literary Digest had correctly predicted the winner in all presidential races since 1916. Then in 1936, based on sample responses, the magazine predicted that Landon would win, 57% to 43%. In fact, Roosevelt won, 62% to 38%. Selection bias Measurement or Response bias Nonresponse bias Systematic rejection bias
Which of the following sampling methods produces a simple random sample? 10. From a class of 25 students, the teacher selects the last 5 to enter the room to be in the sample. • Is a simple random sample • Is not a simple random sample
11. From a group of 100 employees, the manager selects those whose phone numbers end in 7. • Is a simple random sample • Is not a simple random sample
12.A large elementary school has 15 classes with 24 children in each classroom. A sample of 30 is chosen by the following procedure: Each of the 15 teachers selects 2 children from his or her classroom to be in the sample by numbering the children from 1 to 24, then using a random digit table to select two different numbers between 01 and 24. The two children with those numbers are in the sample. • Is a simple random sample • Is not a simple random sample
13. Suppose that in a class of 24 there are 12 boys and 12 girls. The teacher selects 6 students for a sample by numbering the boys from 1 to 12 and the girls from 1 to 12. Then using a random digit table, the first number between 01 and 12 is a boy, the next number between 01 and 12 is a girl and so on until the 6 students are selected. • Is a simple random sample • Is not a simple random sample
14. Suppose that in a class of 24 there are 12 boys and 12 girls. The teacher selects 6 students for a sample by numbering the boys from 1 to 12 and the girls from 13 to 24. Then she uses a random number table to select 6 two-digit numbers between 01 and 24. • Is a simple random sample • Is not a simple random sample
Definitions: 1) Observational study - observe outcomes without imposing any treatment 2) Experiment - actively impose some treatment in order to observe the response
3)Experimental unit – the single individual (person, animal, plant, etc.) to which the different treatments are assigned 4) Factor – is the explanatory variable – it’s what we test 5) Level – a specific value for the factor
6) Response variable – what you measure 7) Treatment – a specific experimental condition applied to the units
8) Control group – a group that is used to compare the factor against; can be a placebo or the “old” or current item 9) Placebo – a “dummy” treatment that can have no physical effect
10) blinding - method used so that units do not know which treatment they are getting 11) double blind - neither the units nor the evaluator know which treatment a subject received
Principles of Experimental Design • Control of effects of extraneous variables on the response – by comparing treatment groups to a control group (placebo or “old”) • Replication of the experiment on many subjects to quantify the natural variation in the experiment • Randomization – the use of chance to assign subjects to treatments
The ONLY way to show cause & effect is with a well-designed, well-controlled experiment!!!
Example 1: A farm-product manufacturer wants to determine if the yield of a crop is different when the soil is treated with three different types of fertilizers. Fifteen similar plots of land are planted with the same type of seed but are fertilized differently. At the end of the growing season, the mean yield from the sample plots is compared. Experimental units? Factors? Levels? Response variable? How many treatments? Plots of land Type of fertilizer Fertilizer types A, B, & C Yield of crop 3
Example 2: A consumer group wants to test cake pans to see which works the best (bakes evenly). It will test aluminum, glass, and plastic pans in both gas and electric ovens. Experiment units? Factors? Levels? Response variable? Number of treatments? Cake batter Two factors - type of pan & type of oven Type of pan has 3 levels (aluminum, glass, & plastic & type of oven has 2 levels (electric & gas) How evenly the cake bakes 6
Experiment Designs • Completely randomized – all experimental units are allocated at random among all treatments Random assignment
Randomized block – units are blocked into groups (homogeneous) and then randomly assigned to treatments Random assignment Units should be blocked on a variable that effects the response!!!