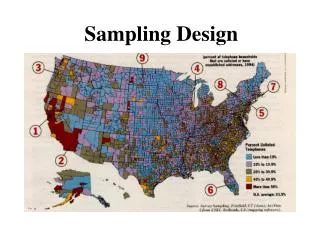
Sampling Design Avoiding Pitfalls in Environmental Sampling Part 1
370 likes | 553 Views
Sampling Design Avoiding Pitfalls in Environmental Sampling Part 1. Part of U.S. Environmental Protection Agency Technical Sessions. Employing Best Management and Technical Practices in Site Cleanup Programs Introduction to the Tools and Mechanics of Systematic Planning

Sampling Design Avoiding Pitfalls in Environmental Sampling Part 1
E N D
Presentation Transcript
Sampling DesignAvoiding Pitfalls in Environmental SamplingPart 1
Part of U.S. Environmental Protection Agency Technical Sessions • Employing Best Management and Technical Practices in Site Cleanup Programs • Introduction to the Tools and Mechanics of Systematic Planning • Demonstration of Method Applicability and QC for XRF • Green Remediation • Critical Role of Data Management • Best Management Practices: Conceptual Site Models • Best Management Practices: Dynamic Work Strategies • (EU Panel) Systematic planning, dynamic work plans, and real-time measurement techniques (the Triad) can help clarify and strengthen statistical analyses
U.S. EPA Technical Session Agenda • Welcome • Understanding: Where does decision uncertainty come from? • Criteria:You can’t find the answer if you don’t know the question! • Pitfalls:How to lie (or at least be completely wrong) with statistics… • Solution Options:Truth serum for environmental decision-making
Understanding: Where Does Decision Uncertainty Come From? “Doubt is not a pleasant condition, but certainty is absurd.” Voltaire, humanist, rationalist, & satirist (1694 - 1778)
Common Questions Statistics Are Used to Address • Does a site pose unacceptable human health risks? • How much contaminated soil volume is there? • Do our sample results differ from background? • What risks do our sample results represent? • How much contamination is present? • Do our sample results meet cleanup goals?
“As we know, there are known knowns. There are things we know we know. We also know there are known unknowns. That is to say we know there are some things we do not know. But there are also unknown unknowns, the ones we don't know we don't know.” Donald Rumsfeld, February 12, 2002, U.S. Department of Defense news briefing Facts Uncertainty Surprises 6
Decision Uncertainty Comes from a Variety of Sources • Political, economic, organizational, and social uncertainty (outside scope). • Model uncertainty (also outside scope). • Data uncertainty: the uncertainty introduced into decision-making by uncertainty associated with data sets used to support decisions…where statistics play a role.
Sampling Analysis Interpretive Sampling Design Sub- Sampling Extract Cleanup Method Result Reporting Relationship between Measurement Parameter & Decision Parameter Sample Preservation Sample Prep Method Sample Support Determinative Method Decision Quality Only as Good as the Weakest Link in the Data Quality Chain Each link represents a variable contributing toward the quality of the analytical result. All links in the data qualitychain must be intact for data to be of decision-making quality!
Analytical Sample Unit 23.4567 ppm Taking a Sample for Analysis Population Soil Core Sample Lab Subsamples (Duplicates) GC Analytical Sample Prep Field Subsample
Historically Focus Has Been Analytical Quality • Emphasis on fixed laboratory analyses following well-defined protocols • Analytical costs driven to a large degree by QA/QC requirements • Result: • Analytical error typically on order of 30% for replicate analyses • Traditional laboratory data treated as “definitive”…but definitive about what?
Within-Sample Variability: Interaction between Contaminant & Matrix Materials Adapted from ITRC (2003) The decision determines representativeness
Uncertainty Math Magnifies Weakest Link’s Effects in Data Quality Chain Uncertainties add according to (a2 + b2 = c2) TotalUncertainty AnalyticalUncertainty SamplingUncertainty • Example: • AU = 10 ppm, SU = 80 ppm: TU = 81 ppm • AU = 5 ppm, SU = 80 ppm: TU = 80 ppm • AU = 10 ppm, SU = 40 ppm: TU = 41 ppm • AU = 20 ppm, SU = 40 ppm: TU = 45 ppm
How Do We Reduce Data Uncertainty? • For analytical errors: • Switch to a better analytical technique • Improve QC on existing techniques • For sample prep and handling errors: • Improve sample preparation • For sampling errors: • Collect samples from more locations
Sometimes the Simplest Questions are the Most Complex… • Does this site pose an unacceptable risk? • Do ground water concentrations exceed drinking water standards? • Do soil concentrations exceed cleanup requirements? Criteria:You can’t find the answer if you don’t know the question!
For Soils, Three Cleanup Requirement Definitions are Most Common: • Never-to-Exceed Criteria: “Lead concentrations cannot be > 400 ppm” • Hot-Spot Criteria: “Lead concentrations cannot be > 400 ppm averaged over 100 m2” • Averaged Criteria: “The average concentration of lead over an exposure unit cannot be > 400 ppm”
The Decision Unit is Often NotWell-Defined “Lead should not exceed 400 ppm in soils” or “TCE should not exceed 5 ppb in ground water” Decisions are often ambiguous because cleanup criteria do not provide enough information to define the decision units.
Advances in Sampling & Measurement Technologies HighlightRepresentativeness Issues Action Level Multi-Increment Samples Discrete Samples XRF Readings
“He uses statistics like a drunk uses a lamp post….for support rather than illumination” Pitfalls:How to Lie (or at least be completely wrong) with Statistics Mark Twain 1835-1910
Tools in Your Statistical Deception Arsenal • Obscure the question… • The representative sample that isn’t… • Pretend the world is normal… • Assume we know when we don’t… • Ignore short-scale heterogeneity… • Miss the forest because of the trees… • Regress instead of progress… • Statistical dilution is the solution… • Worship the laboratory…
1. Obscure the Question • Vague cleanup definitions and unclear decision statements will obscure the question: • Trying to hide contamination? • Increase sample support/cut sample numbers! • Trying to show contamination? • Shrink sample support/increase sampling density! • No technical basis forderiving sample numbers for this kind of question.
2. The Representative Sample that Isn’t • Mislead by feeding non-representative samples into statistical analyses: • Select a non-representative vertical sampling interval • Use spatially clustered locations or biased samples when calculating average concentrations • Mis-match sample support with cleanup criteria
3. Pretend the World is Normal • Normal is Nice! • Normal distributions make statistics easy • Can ignore complexities of spatial & non-random relationships • Many common statistical tests (typical UCL calculation, Student t test, etc.) assume normality
Assuming Normality Can Under-estimate the 95% UCL on the Mean • 4 lab lead results: 20, 24, 86, and 189 ppm • Average of the 4 results: 80 ppm • ProUCL 95%UCL calculation on the 80 ppm average: • Normal distribution 95% UCL: 172 ppm • Gamma distribution: 434 ppm • Lognormal distribution: 246 – 33,835 ppm • Non-parametric distribution: 144 – 472 ppm
4. Assume We Know When We Don’t • A key question in the design of statistically-based sampling programs is: How many samples do we need? • Information required when calculating sample numbers to determine if mean is above or below a threshold: • Variability that will be present • Gray region definition • Underlying contaminant distribution
5. Ignore Short-Scale Heterogeneity • Short-scale heterogeneity refers to variations in contaminant concentrations within a small radius (few feet to few yards) • Assume discrete sample result from an area is “representative” of its immediate surroundings • Particularly useful if we want to miss localized contamination • Increases the chance that “hot spots” will be missed!
2 7 6 1 3 4 5 In Reality, It May Look Like This… • Assume level of concern: 1,000 ppm • Average: 16,280 ppm • One sample has a 43% chance of missing the presence of a hot spot 286 ppm 416 ppm 41,400 ppm 136 ppm 1,220 ppm 2 ft 27,700 ppm 42,800 ppm Figure adapted from Jenkins (CRREL), 1996
6. Miss the Forest Because of the Trees • Base decisions on only handful of laboratory results plus statistical analysis of those results • Under-invest in collecting other forms of pertinent information (CSM and weight-of-evidence lacking) • Use statistical tests to remove “outliers” from the data set • Actual outliers can be very important - you may be discarding evidence telling you the CSM is wrong • Reject field techniques that may be cheaper and build accurate CSM, but are not traditional and may have lower analytical quality and different QC
Data Only Become Meaningful When Site Information is Viewed Holistically
7. Regress Instead of Progress • Require numerical regression comparability between paired field analytic and lab data. Hold field data to a higher standard than lab data. • Reject the field data if R2 not “good enough,” even when lab duplicates show same or worse comparability to each other • Pretend that 2 different labs could pass the regression test • Ignore field analytics QC in project design and in data review • Base data comparability on regression’s R2, ignoring better regression indicators, such as slope and intercept. • Include all paired data in the regression (ignoring artifacts at concentration extremes and relevance to decision-making). • Pretend that quantitative comparability is required for the decision, even when it is not.
Example: XRF and Lead • Full data set: • Wonderful R2 • Unbalanced data • Correlated residuals • Apparently poor calibration • Trimmed data set: • Balanced data • Correlation gone from residuals • Excellent calibration • R2 drops significantly
8. Statistical Dilution is the Solution • Common error of statistics users: calculate sample numbers (n) using an averaging program, but then compare each individual sample result to the action level (a do-not-exceed decision), rather than compare data set’s average • Statistics software users routinely use software without realizing the statistical calculations do not take area size into account when predicting n. • When designing investigations, using inappropriately large decision units dilutes sample density (fails to predict enough samples per unit area), making it less likely to find contamination • When analyzing data, using large decision units will dilute averages and potentially dilute standard deviation estimates (artificially lowering the 95% UCL)
An Example of the Dilution Effect… EU Area: ¼ acre Average: 97 ppm St Dev: 146 ppm 11 ppm 13 ppm Exposure Unit 1 acre 7 ppm 240 ppm EU Area: ½ acre Average: 57 ppm St Dev: 102 ppm 350 ppm 25 ppm Exposure Unit ½ acre 8 ppm 8 ppm EU Area: 1 acre Average: 12 ppm St Dev: 6 ppm 10 ppm Exposure Unit ¼ acre 90 ppm 19 ppm 12 ppm 6 ppm 22 ppm
Site Specific Risk or Dose-Based Requirements Plant Foods Drinking Milk Meat Water Dust, Inhalation Soil Ingestion Infiltration External Fish Radioactively Contaminated Material in Soil Contaminated Material in Soil Leaching Surface Water Groundwater The Real Issue is That Exposure Unit Size & Cleanup Requirement Should be Linked Hot Spot Level Risk Isopleth EU Average Level Hot Spot Area EU Area
9. Worship the Laboratory May the Great ICP of the Galaxy forever grant me high quality metals data!!
Assume the Lab is Infallible • Focus on laboratories’ analytical data quality and assume laboratory data has no error • Assumed corollary: a few expensive lab results are much better than a bunch of cheaper field results • Base decisions strictly on a handful (since that’s all we can afford) of “definitive” expensive laboratory results
Triad Data Collection Design and Analysis Built On: • Planning systematically (CSM) • Improving representativeness • Increasing information available for decision-making via real-time methods • Addressing the unknown with dynamic work strategies