Download
1 / 10
100 likes | 230 Views
Several taste tests were conducted around the country on a new hot sauce. Consumers were asked to rate the level of spiciness on a scale of 1 to 10, with 10 being extremely spicy. The mean ratings of these samples were: 2 2 4 4 4 5 5 6 6 6 7 7 7 7 7 7 8 8 9 9 .

E N D
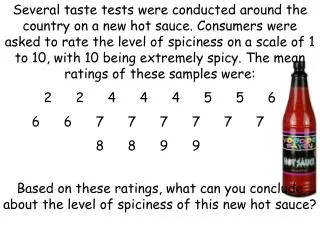
Several taste tests were conducted around the country on a new hot sauce. Consumers were asked to rate the level of spiciness on a scale of 1 to 10, with 10 being extremely spicy. The mean ratings of these samples were: 2 2 4 4 4 5 5 6 6 6 7 7 7 7 7 7 8 8 9 9 Based on these ratings, what can you conclude about the level of spiciness of this new hot sauce?
Warm-Up 2 1/3/2011 In a golf tournament, the top 6 men’s and women’s scores are given. Draw a parallel box plot graph.
Comparing Statistics • When asked to compare data sets, you should look at the differences in EACH measure of central tendency. • Also, use a box plot so you can VISUALLY see the differences in the data sets
Golf Example: Compare the data sets Men’s: 65, 68, 70, 72, 73, 75 Women’s: 69, 71, 73, 74, 77, 80
Examples of questions you should answer when comparing: • Whose mean is greater? What does that mean? • Whose range is greater? What does that mean? • Whose IQR is greater? What does that mean? • Whose Maximum/Minimum Value is greater? What does that mean?
BONUS! • What is the EXPECTED golf score for the women and the men? • What is the PROBABILITY that a woman scored a 71 or an 80? • What is the PROBABILITY that a golfer scored a 73?
6.7 Deviation = difference The deviation from the mean is the difference of a data value and the mean of a data set.
Mean: 70.5 Mean: 74 Mean Absolute Deviation
Mean Absolute Deviation Find the mean absolute deviation of the data. (Round to the nearest tenth if necessary) • 10, 7, 13, 10, 8 • 87, 75, 85, 77, 74, 82
Homework Finish the Worksheet